The exam loves "name the bias" and "pick the study design." Two scientists run the same experiment and get opposite answers because one of them got fooled. Your job: spot exactly how. No more guessing between lead-time and length-time at 2am.
A news headline reports: "New screening scan boosts 5-year cancer survival from 40% to 78%." Patients who got the scan were diagnosed an average of 3 years earlier than patients who waited for symptoms. But when researchers counted how many people actually died of the cancer, the death rate was identical in both groups. Same number of deaths. The only thing that changed was that the scanned group "knew" about their cancer for longer.
What flaw is inflating that survival number?
Selection bias
Lead-time bias
Recall bias
Confounding
Same deaths, longer "survival" = lead-time bias.
Picture two people on a train heading to the same final stop at the same time. One of them boarded three stations earlier. That person was "on the train longer," but they both arrive at the exact same moment. The scan just moved the boarding point earlier (the diagnosis date), so the clock started sooner. Nobody actually lived longer. The proof is the death rate: it never budged.
The clean tell: if the headline brags about survival time from diagnosis but the actual death rate is unchanged, the survival gain is fake. Real benefit shows up as fewer deaths, not a longer countdown. By the end of this page you will name this in one read.
Quick route: pick the move that should happen before memorizing labels.
Good. The board pays you for routing the deciding clue, then naming the label.
The Study Design Ladder
Before you can name a flaw, you have to know what kind of study you are looking at. Designs stack from weakest to strongest. Tap each rung. The board hides the design in the first sentence of the stem, so learn to spot it fast.
One punchline: higher on the pyramid means better control of bias. The top synthesizes many studies; the bottom is a single snapshot or a single patient.
🏔 Evidence pyramid · tap to zoom
1Case report / case seriesweakest▶
One patient, or a handful. Great for spotting something brand new (a weird drug reaction nobody has seen). No control group, so you cannot prove cause. It is a story, not evidence. Think of it as a single Yelp review: useful tip, not a verdict.
2Cross-sectionalsnapshot▶
A photo of a population at one moment. Measures exposure and disease at the same time, so it tells you prevalence (how many have it right now). Cannot tell which came first, the chicken or the egg. Good for "how common is this," useless for "what caused it."
3Case-controllooks back▶
Starts with the disease. Grab people who already have it (cases) and people who do not (controls), then look backward at what they were exposed to. Gives an odds ratio. Best for rare diseases, because you do not have to wait around for a rare event to happen. Retrospective by nature.
4Cohortfollows forward▶
Starts with the exposure. Take exposed and unexposed people and follow them forward to see who gets sick. Gives a relative risk. Best for rare exposures (asbestos workers, a specific drug). Can be prospective or retrospective, but the logic always runs exposure then outcome.
5Randomized controlled trialgold standard▶
The gold standard. You randomly assign who gets the treatment. Randomization is magic: it spreads every confounder (known and unknown) evenly across groups, so the only difference left is the treatment. This is the one design that removes confounding by design.
6Systematic review / meta-analysistop of the pyramid▶
Pools many studies into one mega-result. A meta-analysis statistically combines them so the sample size, and the precision, jumps. Sits at the top because it is the widest view available. Garbage in still means garbage out, but done right it is the strongest single answer.
Stem shortcut: "started with people who have the disease" = case-control. "Followed exposed people forward" = cohort.
At the very top of that pyramid sits the meta-analysis. It pools many studies into one picture: a forest plot. Each line is one study with its confidence interval; the diamond is the combined answer. When a line crosses the vertical "no effect" mark, that study alone was not significant.
📊 Forest plot · tap to zoom
Odds Ratio vs Relative Risk
The design picks the number. Memorize the pairing once and you never re-derive it under pressure.
Odds Ratio (OR)
Comes from case-control studies
You started with disease, so you count odds of exposure
Approximates relative risk when the disease is rare
Mantra: case-Control = Odds
Relative Risk (RR)
Comes from cohort studies (and RCTs)
You followed exposure forward, so you can measure true risk
RR = risk in exposed divided by risk in unexposed
Mantra: cohoRt = Relative Risk
Your move: sort the clues
Drag each clue into the design it points to. (On a phone, tap a chip then tap a bin.) Rare disease and "looked back" go one way; rare exposure and "followed forward" go the other.
Case-control
starts with disease · odds ratio
Cohort
starts with exposure · relative risk
Studying a very rare cancer
Studying a rare exposure (asbestos)
Yields an odds ratio
Yields a relative risk
Looks backward at exposure
Follows subjects forward in time
Nailed it. Rare disease and backward-looking odds = case-control. Rare exposure and forward-following risk = cohort. The design dictates the statistic, every time.
When the Sample Lies
These three biases all happen before any math. They poison the data at the source: who you study, what they remember, and how you measure them. Tap a card to flip it.
🎣
Selection bias
the people studied aren't representative
tap
Your sample is not a fair slice of the population, so the result was rigged before you started. Classic flavors: Berkson bias (using hospital patients as controls, who are sicker than the street), the healthy-worker effect (employed people are healthier than the general public), and non-response bias (the people who skip your survey differ from those who answer).
Fix: random sampling. Pull controls from the same population as the cases.
tap to close
🧠
Recall bias
sick people remember differently
tap
People with a disease ransack their memory for a cause, so they "remember" exposures that healthy people forget. A mom of a sick child recalls every cough syrup; a mom of a healthy child does not. This is the classic curse of case-control studies, because they depend on looking backward at memory.
Fix: use records, not memory. Pharmacy logs and charts do not exaggerate.
tap to close
📏
Measurement bias
the tool or observer is skewed
tap
Also called information bias. A systematic error in how you measure. Includes observer bias (the researcher who knows the group nudges the reading) and the Hawthorne effect (subjects behave better simply because they know they are being watched). The yardstick itself is bent.
Fix: blinding kills observer bias. A miscalibrated scale gets recalibrated.
tap to close
💤
Attrition bias
dropouts aren't random
tap
A subtype of selection bias that happens over time. People who drop out of a study (loss to follow-up) are different from those who stay. If the sickest patients quit, the survivors make the treatment look better than it is. The finish line gets crowded with the people who were doing fine anyway.
Fix: chase complete follow-up; analyze by intention-to-treat.
tap to close
Spot the Bias
A researcher runs a study. Watch it unfold one stage at a time, then call out where the bias snuck in. Press the button to begin.
The Investigator
Mira
Epidemiologist · Case 1 of 3
"I want to know if a popular heartburn drug causes a rare stomach cancer. Let me design the perfect study."
A rare cancer. That word "rare" is already a clue about which design she should reach for.
Stage 1 · The Setup
She picks people who already have the cancer, finds controls without it, and asks both groups about past drug use. Which design is this?
Stage 2 · The Flaw Enters
The cancer patients comb through years of memory for anything that could have caused it. The healthy controls barely try. The two groups are now reporting drug use by different rules. Name the flaw.
Pattern Locked
RECALL BIAS
RouteCase-control depends on memory of past exposure
PearlIf the stem is case-control and asks "why is the link overstated," answer recall bias. Fix it with records, not interviews.
✓
You traced the flaw from design to data. That is exactly the move the exam wants: read the design first, then ask what it lets in.
The Two Screening Traps
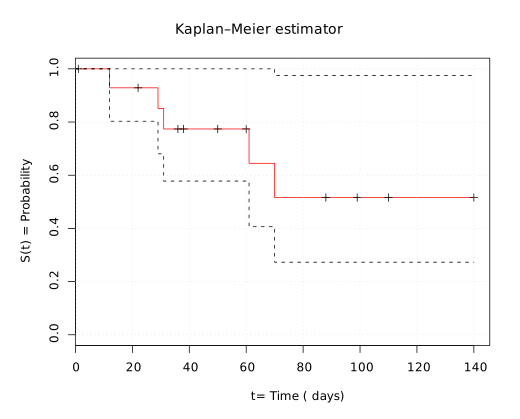
Screening looks like a free win, but two biases make a useless test look life-saving. The board tests the difference between them relentlessly. Here is the picture.
One punchline: screening started the clock earlier, so "survival from diagnosis" stretches, but the patient dies at the same time.
📉 Kaplan-Meier curve · tap to zoom
⏱ Lead-time bias
"You found it earlier. You did not live longer."
Screening moves the diagnosis date earlier. Survival is measured from diagnosis, so it looks longer, but the death date never changes. The countdown just started sooner.
The tell: survival time goes up while the death rate stays the same. Fix: measure disease-specific mortality, or survival from a fixed point, not from diagnosis.
🟪 Length-time bias
"You caught the slow ones."
Slow, lazy tumors sit around for years, so a screen is far more likely to catch them. Fast, aggressive tumors kill between screens and rarely get caught. Screening cherry-picks the indolent cases, which were going to do fine anyway.
The tell: the screened cancers behave better because they are a milder subset. Fix: randomized screening trial with mortality as the endpoint.
Lead-time = same tumor, earlier clock. Length-time = different tumors, the slow ones got caught.
The Third Variable
A coffee study finds coffee drinkers get more pancreatic cancer. Real cause? They also smoke more. A third variable is hiding in the data. But there are two completely different ways a third variable can mess with you, and you treat them oppositely.
One punchline: smoking causes both the coffee habit and the cancer. The coffee-cancer arrow is an illusion the confounder created.
Confounding
"You adjust it away. It's a fake link."
A third variable is tied to both the exposure and the outcome and fakes a relationship. It is a nuisance you want to erase. Control it by randomization, restriction, matching, stratification, or regression.
Stratified tells: within smokers, coffee shows no effect; within non-smokers, no effect. The link vanishes once you account for the confounder.
Effect modification
"You report it stratified. It's real."
The exposure's true effect genuinely differs across levels of a third variable. This is real biology, not noise, so you do not erase it. You report each subgroup separately.
Stratified tells: a drug helps young patients but harms older ones. The effect is different in each stratum, and both numbers are true. Adjusting it away would hide a real finding.
Confounding: the strata look the same after you adjust. Effect modification: the strata genuinely differ, so you keep them apart.
Challenge before the reveal
Same data, two opposite calls. Make your guess first, then the decision tree opens. Guess wrong and the hook re-teaches it on the spot.
A trial reports a drug. Pooled together, it shows no overall effect. But split by age: in patients under 50 it clearly helps, and in patients over 65 it clearly harms. The two halves are real and they point in opposite directions.
Before you peek: should the analyst adjust age away, or report each age group on its own?
Does the effect flip or change size across the third variable, and is that difference real biology?
Yes, the effect itself differs → effect modification. Report each stratum separately. Helps the young, harms the old: both numbers are true and clinically vital. Erasing it would bury a real finding.
No, the third variable just fakes a link → confounding. That is the one you erase, with randomization, restriction, matching, stratification, or regression. The strata look the same once you account for it.
Type I, Type II, and Power
A study can be fooled two ways: see a thing that isn't there, or miss a thing that is. The whole grid hangs off one idea: the null hypothesis says "no effect." Tap a verdict to light up the box.
Null is actually TRUE (no real effect)
Null is actually FALSE (real effect exists)
You REJECT the null (you call it positive)
Type I erroralpha · false positive
Power1 minus beta · true positive
You KEEP the null (you call it negative)
Correcttrue negative
Type II errorbeta · false negative
Tap a verdict above. The matrix lights the box and the meaning lands here.
Order trick: roman numeral one looks like a single stick, like the one false alarm you raised. Type I = you cried wolf (false positive). Type II = you slept through the real wolf (false negative).
The bell curve behind almost every test statistic. The alpha cutoff lives out in the tails: set it too generously and random tail noise gets called a real effect, which is a Type I error. Power is your chance of catching a true effect when one is really there.
📈 Normal curve · tap to zoom
Memory hooks
The pairs that get swapped under pressure. Tap each card to bring the hook into focus.
🚫
Cried wolf vs slept through it
Type I is the boy who cried wolf: he raised an alarm with no wolf there. False positive, alpha. Type II is the village asleep while the real wolf ate the sheep. False negative, beta. One stick (I) = one false alarm.
tap to reveal
⏱️
Lead vs length
Lead-time = the clock starts earlyer (lead like a head start). Same tumor, earlier diagnosis, identical death. Length-time = you caught the long, slow ones that were going to do fine anyway. Lead moves the clock; length picks the slow tumor.
tap to reveal
⚗️
CC = OR, coh = RR
Match the letters. Case-Control gives the Odds ratio (you started with disease, so you can only count odds). CohoRt gives the Relative risk (you followed exposure forward, so you can measure true risk). The design picks the stat. Every time.
tap to reveal
🔮
Adjust vs report
Confounding you adjust away (it is a fake link from a third variable). Effect modification you report stratified (the effect is genuinely different in each group). Fake link erase it; real difference keep it.
tap to reveal
Name the Flaw: the walkthrough
One scenario at a time. Read it, name the bias or the design, then unpack why. The bank shuffles and never repeats a case until you have seen them all. This is the exact muscle the exam tests.
Vignette 1
Desktop: right-click an option to cross it out, double-click to highlight. Phone: long-press to cross out, double-tap to highlight.
Educational content for board preparation. Built on standard public references in epidemiology and biostatistics. Images via Wikimedia Commons. Not a substitute for clinical judgment.
 Bone WizardryMEDICAL EDUCATION