End-diastolic volume (EDV): blood before contraction. End-systolic volume (ESV): blood left afterward. Their difference is stroke volume. [1]
Choose a section or practice
One heart ejects more when it fills more. Another gains little flow but much more pressure. Find out what changed before deciding what the patient needs.
The illustrated values are a controlled example, not normal targets. Starting with 140 mL and leaving 60 mL ejects 80 mL. Starting with 170 mL and leaving the same 60 mL ejects 110 mL. The second contraction ejected more blood without requiring a new nerve signal.
What did filling change inside the muscle?
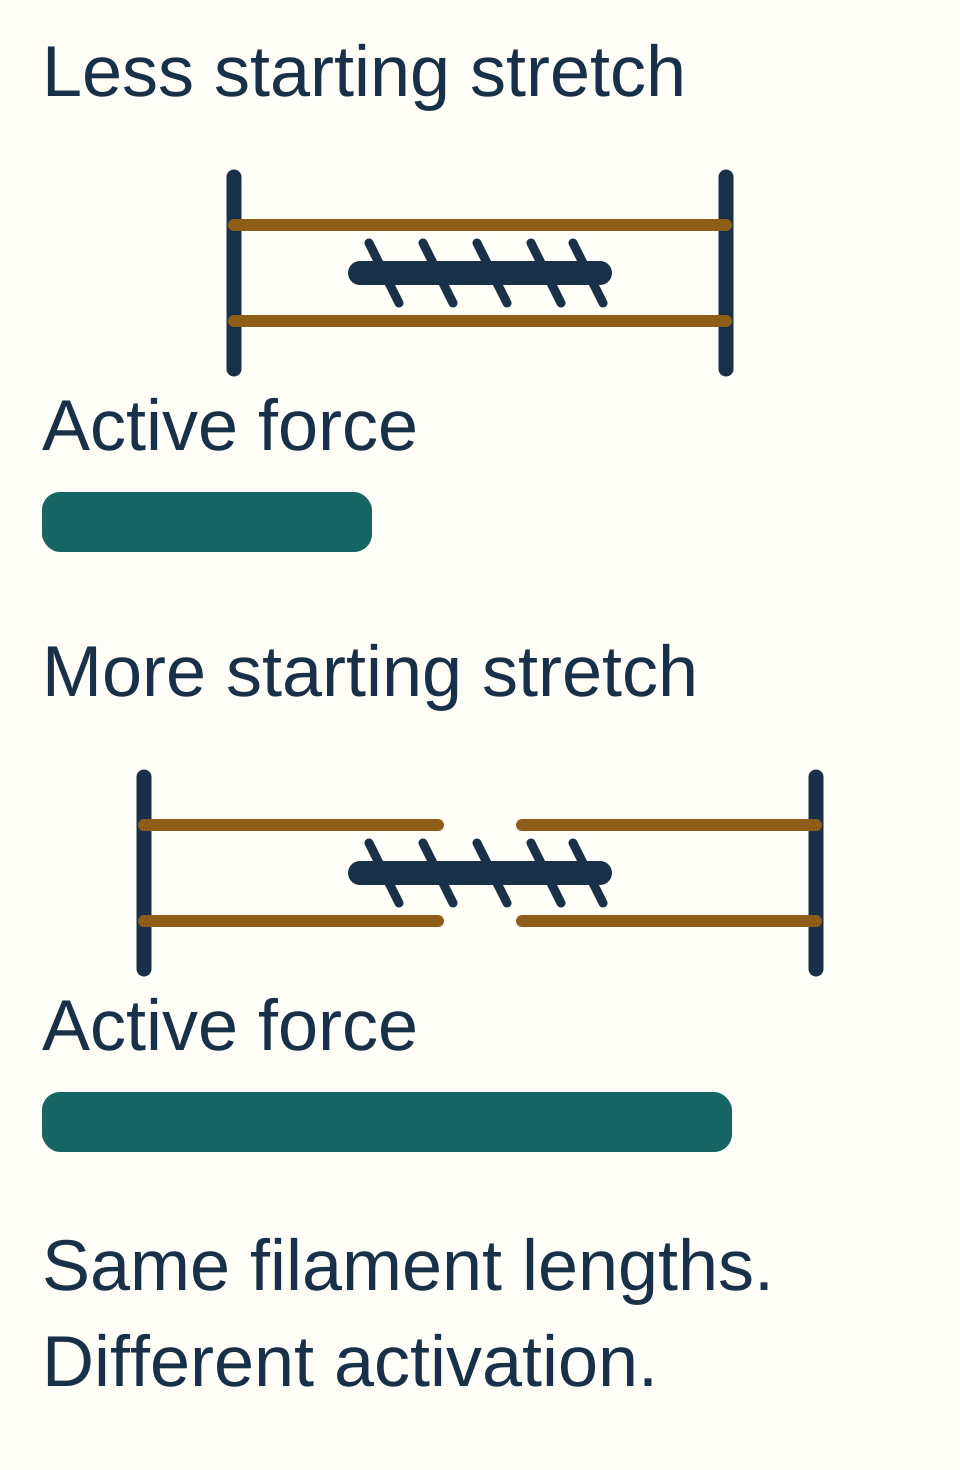
Preload is the stretch before contraction. Greater filling can lengthen the repeating muscle units called sarcomeres. Within their working range, this changes how readily the contractile proteins develop force. That intrinsic response is length-dependent activation, the basis of the Frank-Starling mechanism. [3][4]
Z lines mark the ends; gold lines are thin filaments and navy is thick filament. Their lengths do not change. The force bars are qualitative: working-range stretch alters activation, not just overlap.
Stretch affects myofilament activation and calcium sensitivity; it is not simply a contest to maximize filament overlap. A sarcomere drawing helps locate the parts, but it does not supply a bedside cutoff for fluid treatment. A flat flow response does not prove that a patient's fibers crossed a universal overstretch length. [3][4]
Stroke volume is an amount per cycle. Cardiac output is an amount per minute. Multiply stroke volume by heart rate, then convert mL to liters. For example, 80 mL per cycle at 75 cycles per minute is 6,000 mL/min, or 6 L/min. Ejection fraction is different: SV divided by EDV. [1]
Case 27
Show answer and explanations for case 27
A. Lengthening requires increased catecholamine release to produce the greater force (Why this does not fit)
Prompt 1 of 2: predict, then reveal.
Why do catecholamines matter in intact hearts?
They can increase contractile stimulation and influence calcium handling.
What rules out that required mechanism here?
Neural input and circulating catecholamines are absent, while the length-dependent response persists.
A mechanism requiring intact neural or circulating input cannot explain an isolated permeabilized-fiber response.
Read the complete explanation
Catecholamines can increase contractile stimulation and influence calcium handling. Neural input and circulating catecholamines are absent, while the length-dependent response persists.
B. Lengthening raises force only by increasing the calcium concentration presented to the filaments (Why this does not fit)
Prompt 1 of 2: predict, then reveal.
Why might more calcium raise force?
A larger activating calcium signal can increase contractile activation.
Which measurement shows that more calcium is not required here?
Force rises at the same calcium concentration, and half-maximal force is reached at a lower concentration.
A controlled calcium concentration separates greater sensitivity from delivery of more calcium.
Read the complete explanation
A larger activating calcium signal can increase contractile activation. Force rises at the same calcium concentration, and half-maximal force is reached at a lower concentration.
C. Lengthening increases responsiveness of the contractile machinery to calcium (Best answer)
Prompt 1 of 3: predict, then reveal.
What is held constant in the first comparison?
The free calcium concentration is controlled at the same submaximal value.
What does the lower half-activation concentration show?
Less calcium is needed for the same fraction of maximal force, indicating greater calcium sensitivity.
How does this relate to filling in the intact heart?
It supports an intrinsic length-dependent activation mechanism rather than requiring a new neural signal for every filling change.
Greater force at fixed calcium, with a lower half-activation concentration, supports increased calcium sensitivity.
Read the complete explanation
The free calcium concentration is controlled at the same submaximal value. Less calcium is needed for the same fraction of maximal force, indicating greater calcium sensitivity. It supports an intrinsic length-dependent activation mechanism rather than requiring a new neural signal for every filling change.
D. Lengthening demonstrates that maximal filament overlap is the sole determinant of active force (Why this does not fit)
Prompt 1 of 2: predict, then reveal.
Why is filament geometry relevant?
Starting length changes relationships among contractile structures.
What additional property is directly demonstrated?
The calcium concentration needed for half-maximal force changes; the result is not explained solely by asserting maximal overlap.
An overlap-only explanation is incomplete for the observed calcium-sensitivity shift.
Read the complete explanation
Starting length changes relationships among contractile structures. The calcium concentration needed for half-maximal force changes; the result is not explained solely by asserting maximal overlap.
Takeaway: Greater force at fixed calcium, with a lower half-activation concentration, supports increased calcium sensitivity.
Contractility describes systolic performance at comparable loading conditions. Afterload is the load opposing ejection. Arterial pressure, valve obstruction and ventricular geometry can all contribute. Increasing filling is not the same intervention as strengthening contraction or making ejection easier. [5]
In the curve explorer, changing filling places the dot elsewhere on the same curve. Stronger contraction raises output at the same horizontal position. Harder ejection lowers it. A higher curve alone cannot identify a drug: increased contractility and reduced afterload can both improve ejection. [3]
The slope asks, "How much extra ejection follows this extra filling?" A shallow local slope means less flow gained from that change. It does not, by itself, establish the cause, the patient's blood volume or whether treatment is needed.
Now read one contraction as a loop
A pressure-volume loop plots pressure vertically and volume horizontally. Its width is EDV minus ESV. Its enclosed area represents external stroke work; width and area are not interchangeable. Select one isolated change and inspect which boundary shifts. [7]
The end-systolic pressure-volume relationship concerns systolic behavior. The passive end-diastolic relationship concerns filling stiffness. Do not call the inverse of diastolic compliance the same thing as systolic end-systolic elastance. They describe different parts of the cycle. [2][7]
Dobutamine can increase inotropy, but heart rate and vascular tone may also change. Digoxin inhibits Na-K ATPase, increasing intracellular calcium availability. Milrinone inhibits PDE3, increasing cAMP and combining inotropy with vasodilation. Verapamil can reduce contractility. These are different mechanisms, not interchangeable treatments for a low output number. [6][22][23][24]
3. Where did the blood go?
The ventricle does not choose its own filling. Blood must return through the veins, pass the right heart and lungs, then enter the left heart. Venous pooling can reduce central filling without removing blood from the body. Blood loss reduces the total amount available. Keep redistribution separate from loss. [8]
Standing permits dependent venous pooling before reflex compensation. During exercise, muscle pumping helps venous return while sympathetic activity affects heart rate and contraction. Nitroglycerin increases venous capacitance, allowing more blood to remain away from the central circulation; this is not immediate renal fluid loss. [8][21]
In late pregnancy, the supine uterus can compress the vena cava; lateral positioning can improve venous return. In acute right ventricular pressure overload, dilation and septal displacement can limit left ventricular filling. More fluid is not a universal solution to a dilated, overloaded right ventricle. [9][20]
Pressure inside is not the pressure stretching the wall
Transmural pressure is inside pressure minus surrounding pressure. During tamponade, high pericardial pressure can leave little effective distending pressure despite a high measured right atrial pressure. A high intracavitary number therefore does not prove generous filling. The limiting problem is external compression. [10]
Constrictive pericardial disease is different: the rigid surrounding structure limits filling and produces marked ventricular interdependence. Tamponade and constriction share constraint, not an identical waveform pattern. Clinical context, echocardiography and, where indicated, respiratory pressure relationships distinguish them. [10]
Leaving the ventricle is not always reaching the body
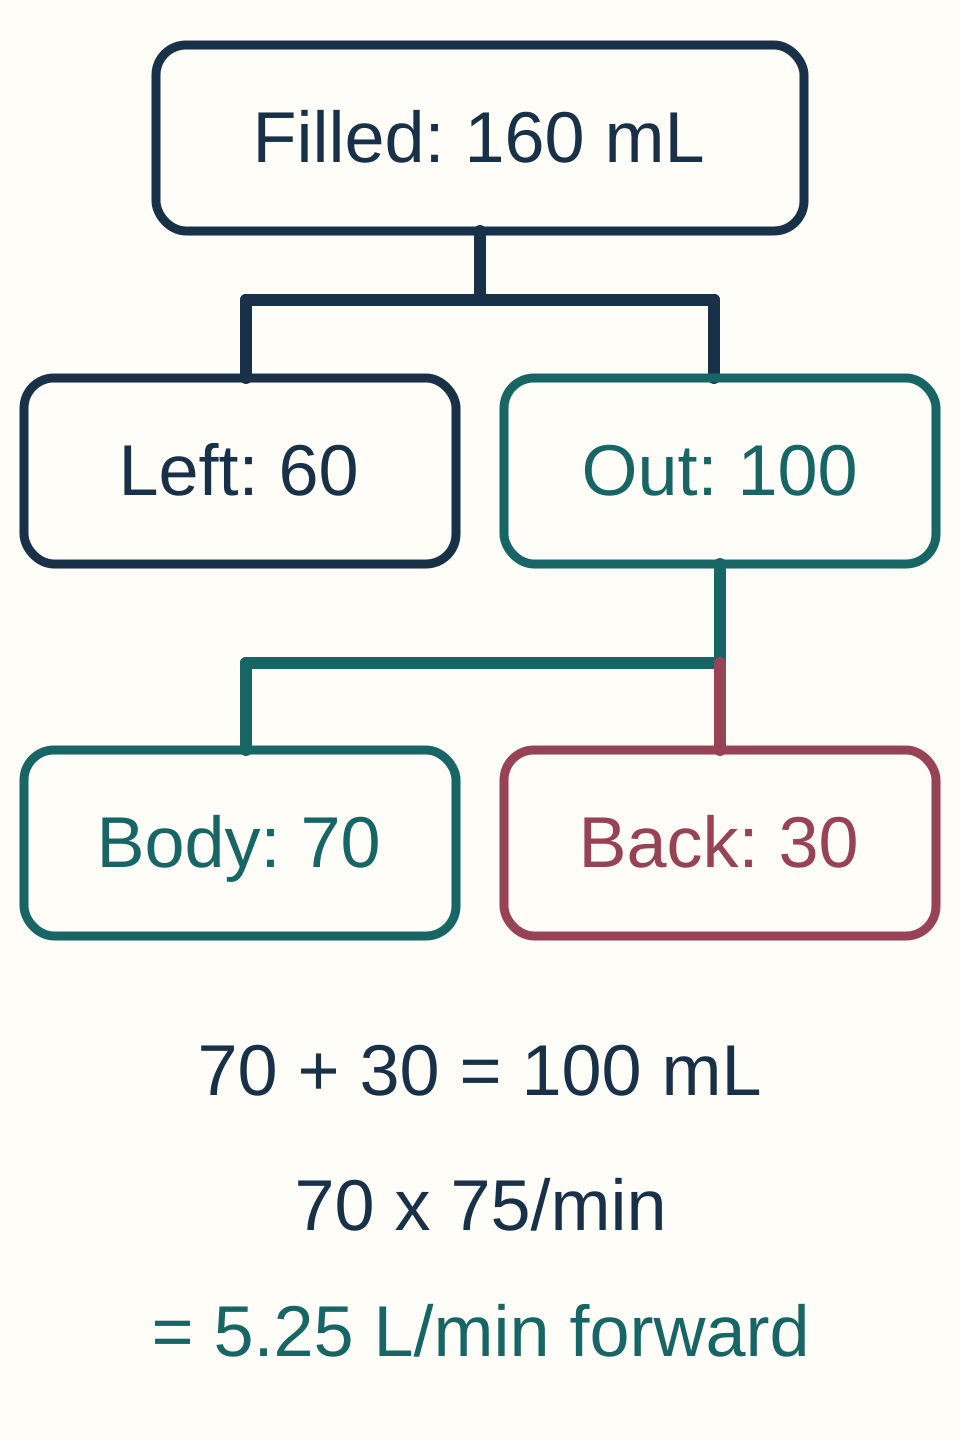
With mitral regurgitation (MR), some systolic ejection returns to the left atrium. EDV minus ESV still measures total ejection, but not all of it is useful forward flow. Divide the same ejected volume between two exits below. [11]
Follow both destinations. Total ejection is 100 mL, but only 70 mL reaches the body. The labeled volumes are a constructed teaching example, not patient measurements.
Forward stroke volume = total stroke volume minus regurgitant volume. Multiply the forward amount by heart rate to obtain effective systemic output when there is no other leak or shunt. A seemingly preserved EF can conceal impaired forward performance; in severe primary MR, an EF of 60% is not the reassurance it would appear to be. [11]
Case 20
Show answer and explanations for case 20
A. 35 mL regurgitant; 5.4 L/min systemic (Best answer)
Prompt 1 of 3: predict, then reveal.
What is total ventricular stroke volume?
170 minus 60 equals 110 mL per cycle.
How much of that volume did not pass forward into the aorta?
110 minus 75 equals 35 mL of regurgitant volume.
Which amount determines systemic output here?
Forward SV of 75 mL multiplied by 72/min is 5,400 mL/min, or 5.4 L/min.
Calculate total ejection first, then separate the destination that actually reaches the body.
Read the complete explanation
170 minus 60 equals 110 mL per cycle. 110 minus 75 equals 35 mL of regurgitant volume. Forward SV of 75 mL multiplied by 72/min is 5,400 mL/min, or 5.4 L/min.
B. 35 mL regurgitant; 7.92 L/min systemic (Why this does not fit)
Prompt 1 of 2: predict, then reveal.
What does 7.92 L/min calculate?
110 mL of total ejection multiplied by 72/min gives 7.92 L/min.
Why is that not effective systemic output here?
It includes the 35 mL per cycle returning through the mitral valve; only 75 mL per cycle travels forward.
Total ventricular output can overstate systemic delivery when some ejection regurgitates.
Read the complete explanation
110 mL of total ejection multiplied by 72/min gives 7.92 L/min. It includes the 35 mL per cycle returning through the mitral valve; only 75 mL per cycle travels forward.
C. 60 mL regurgitant; 5.4 L/min systemic (Why this does not fit)
Prompt 1 of 2: predict, then reveal.
Why might 60 mL attract attention?
It is the measured end-systolic volume remaining in the ventricle.
Where is the regurgitant amount found instead?
Subtract forward ejection from total ejection: 110 minus 75 is 35 mL.
Residual ventricular volume is not the volume that regurgitated.
Read the complete explanation
It is the measured end-systolic volume remaining in the ventricle. Subtract forward ejection from total ejection: 110 minus 75 is 35 mL.
D. 75 mL regurgitant; 2.52 L/min systemic (Why this does not fit)
Prompt 1 of 2: predict, then reveal.
What would 2.52 L/min represent?
A 35 mL volume multiplied by 72/min gives 2.52 L/min.
Which destination does that 35 mL have?
It is the regurgitant portion, whereas the measured forward stroke volume is 75 mL.
Do not swap the forward and backward destinations.
Read the complete explanation
A 35 mL volume multiplied by 72/min gives 2.52 L/min. It is the regurgitant portion, whereas the measured forward stroke volume is 75 mL.
Takeaway: Calculate total ejection first, then separate the destination that actually reaches the body.
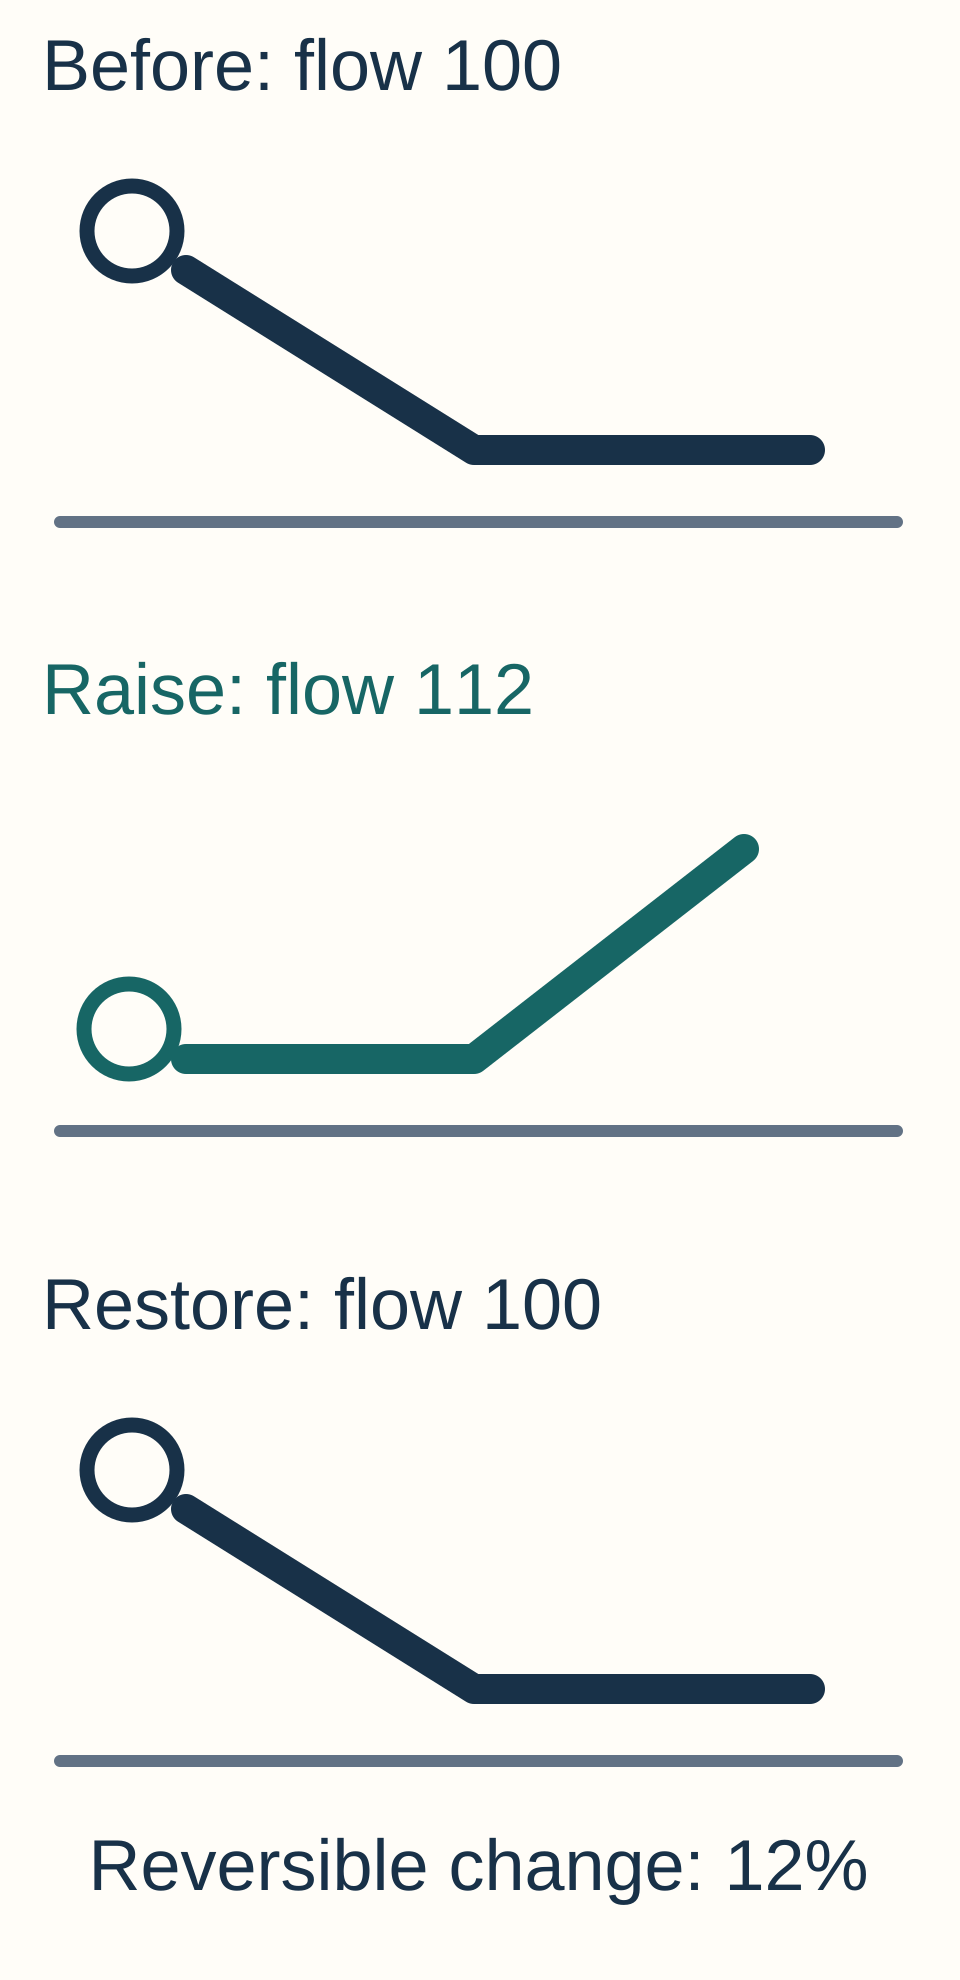
A passive leg raise (PLR) temporarily transfers blood toward the chest. Measure stroke volume or cardiac output while the position changes, then check the return toward baseline. The example below starts semirecumbent, lowers the trunk and raises the legs. It adds no external fluid. [12][13]
The example has a 12% reversible flow increase, not a measured 12% volume deficit. Responsiveness, need for fluid, and tolerance remain separate decisions.
A rise from 100 to 112 is a 12% change: 12 divided by the starting 100. It is not a 12% blood-volume deficit. Flow-based PLR thresholds are often around 10%, but interpretation depends on the measurement method, precision and test conditions. Blood pressure alone is not an equivalent flow measurement. [12][14]
Keep three different questions separate
Responsiveness: did flow rise during the test? Need: is tissue perfusion inadequate? Tolerance: is additional fluid likely to worsen congestion? A positive test answers the first question, not all three. A comfortable, adequately perfused patient can still be responsive. [14][15]
Spontaneous breaths and an irregular rhythm can undermine some respiratory variation indices. They do not automatically invalidate a properly performed PLR assessed by direct, timely flow measurement. Reproducibility, reversible changes, adequate measurement and the clinical setting still matter. [12]
In septic shock, an initial resuscitation recommendation is not a command to repeat boluses indefinitely. Reassess perfusion, response and congestion. Vascular tone and cardiac function may require attention instead of more volume. An educational curve cannot replace that bedside assessment. [14][15]
Case 28
Show answer and explanations for case 28
A. SV increased approximately 13%; the maneuver alone establishes a fluid indication (Why this does not fit)
Prompt 1 of 2: predict, then reveal.
What percentage increase follows from the measured VTI change?
At unchanged outflow area, relative SV change equals relative VTI change: (13.8 - 12.0)/12.0 = 15%. Dividing by the final value produces the tempting 13%.
What does a reproducible positive response establish about giving fluid?
A positive response supports recruitable flow under the test conditions; need and tolerance must be assessed separately.
Use the baseline denominator and distinguish response from treatment need.
Read the complete explanation
At unchanged outflow area, relative SV change equals relative VTI change: (13.8 - 12.0)/12.0 = 15%. Dividing by the final value produces the tempting 13%. A positive response supports recruitable flow under the test conditions; need and tolerance must be assessed separately.
B. SV increased approximately 15%; the maneuver alone establishes a fluid indication (Why this does not fit)
Prompt 1 of 2: predict, then reveal.
What percentage increase follows from the measured VTI change?
The 15% calculation is correct because the baseline 12.0 cm is the denominator.
What does a reproducible positive response establish about giving fluid?
The indication claim is too strong: the reversible response alone does not establish that fluid is needed or tolerated.
A correct response magnitude does not prove a fluid indication.
Read the complete explanation
The 15% calculation is correct because the baseline 12.0 cm is the denominator. The indication claim is too strong: the reversible response alone does not establish that fluid is needed or tolerated.
C. SV increased approximately 15%; the maneuver alone does not establish a fluid indication (Best answer)
Prompt 1 of 2: predict, then reveal.
What percentage increase follows from the measured VTI change?
The VTI rise is 1.8 cm above baseline 12.0 cm, giving a 15% SV increase at constant outflow area.
What does a reproducible positive response establish about giving fluid?
Reproducible increased flow supports responsiveness, not an independent fluid indication. Perfusion need and congestion tolerance remain separate assessments.
Calculate the response, then state exactly what the test can and cannot establish.
Read the complete explanation
The VTI rise is 1.8 cm above baseline 12.0 cm, giving a 15% SV increase at constant outflow area. Reproducible increased flow supports responsiveness, not an independent fluid indication. Perfusion need and congestion tolerance remain separate assessments.
D. SV increased approximately 13%; the maneuver alone does not establish a fluid indication (Why this does not fit)
Prompt 1 of 2: predict, then reveal.
What percentage increase follows from the measured VTI change?
The limit on the fluid inference is correct, but the percentage uses the wrong denominator: 1.8/12.0 = 15%, not 1.8/13.8.
What does a reproducible positive response establish about giving fluid?
Return to baseline supports a reversible test response; it does not convert responsiveness into a treatment indication.
A sound clinical limitation does not fix an incorrect percentage.
Read the complete explanation
The limit on the fluid inference is correct, but the percentage uses the wrong denominator: 1.8/12.0 = 15%, not 1.8/13.8. Return to baseline supports a reversible test response; it does not convert responsiveness into a treatment indication.
Takeaway: Calculate the response, then state exactly what the test can and cannot establish.
Compliance describes how much volume changes for a pressure change. A stiff chamber needs a larger pressure increase to accept the same additional volume. Compare the two passive filling curves at the same EDV. These are not contractility curves. [2]
The lower curve represents a smaller pressure cost at each illustrated volume. The steeper curve represents a larger cost. Actual diastolic pressure also depends on relaxation and external constraint; pressure and EDV are not interchangeable measurements of preload. A larger cavity does not guarantee a more compliant chamber. [2][16]
Compensation can help flow and harm the lungs
After myocardial injury, less effective ejection can leave more blood behind. Neurohormonal responses support pressure and retain salt and water. Increased filling can temporarily help output, but can also raise upstream pressure and congestion. Compensation is not recovery of the injured muscle. [18]
Pressure and volume loads remodel the ventricle differently. Greater wall thickness can reduce systolic wall stress for a given chamber radius and pressure. Dilation increases radius and can increase that stress. Fibrosis, wall thickness and operating volume all affect the pressure cost of filling; cavity size alone does not settle the question. [2][5]
In heart failure with reduced EF (HFrEF), systolic dysfunction is important, but diastolic impairment can coexist. In heart failure with preserved EF (HFpEF), EF at rest does not establish normal filling pressure or exercise reserve. Removing excess fluid can relieve congestion while leaving output similar when little useful flow depended on the removed filling. [16][18]
Do not turn one echo ratio into a diagnosis
The mitral E wave reflects early filling; the A wave reflects filling with atrial contraction. Their ratio can suggest a pattern, but it changes with age, rhythm, loading and disease. A low E/A ratio alone neither grades the entire disorder nor establishes normal filling pressure. [16]
The 2025 echocardiographic approach integrates measures of myocardial relaxation, estimates of filling pressure, atrial structure or function, and clinical context. Poor-quality or conflicting signals need reassessment, not a forced label. Special settings such as significant valve disease and atrial fibrillation need their appropriate approach rather than an indiscriminate general algorithm. [16]
Slow relaxation can coexist with a nearly normal E/A ratio when higher atrial pressure drives early filling. A standardized Valsalva maneuver reduces filling; a fall in E/A of at least 50% supports elevated baseline filling pressure. Interpret the response with the other measurements, not alone. [16]
A biomarker is evidence, not a verdict
Natriuretic peptides respond to cardiac wall stress and have counter-regulatory actions. Interpret them with symptoms, examination, renal function and imaging. Obesity can lower measured concentrations; a value below a usual threshold does not automatically exclude HFpEF in a compatible setting. [16][26]
Sacubitril inhibits neprilysin, which affects BNP handling. NT-proBNP is not cleared by that enzyme in the same way. After starting sacubitril/valsartan, BNP and NT-proBNP can therefore change differently. Do not diagnose worsening congestion from an isolated BNP rise when the rest of the assessment points elsewhere. [17]
6. Choose the purpose before choosing the treatment
A treatment can improve an immediate hemodynamic number without improving long-term outcomes. Another can initially reduce contractile stimulation yet improve outcomes over time. Select the problem you are trying to solve, then follow the mechanism. [6][18]
Inotropy, decongestion and disease modification are different goals. Selected low-output states may need monitored short-term inotropic support. Congestion may need diuresis. A stable HFrEF patient may benefit from an evidence-based beta blocker despite its initial negative inotropic effect. Do not start that explanation with "a stronger squeeze is always better." [6][18]
Foundational HFrEF therapy combines an angiotensin receptor-neprilysin inhibitor, or an appropriate renin-angiotensin alternative, an evidence-based beta blocker, a mineralocorticoid receptor antagonist (MRA), and an SGLT2 inhibitor when appropriate. An MRA blocks aldosterone signaling; kidney function and potassium require monitoring. A loop diuretic relieves congestion but does not replace those disease-modifying classes. [18]
Electrical rescue is not the same as coordinated contraction
An implantable cardioverter-defibrillator (ICD) treats dangerous ventricular rhythms. For primary prevention after an infarction, timing, persistent dysfunction despite treatment, symptoms and expected survival matter. A low EF twelve days after an infarction is not, by itself, an indication for immediate primary-prevention implantation. Applicable post-infarction waiting and reassessment criteria must be met. [18]
Cardiac resynchronization therapy (CRT) coordinates ventricular activation. The classic strong-benefit profile includes persistent symptoms despite appropriate therapy, low EF, sinus rhythm, left bundle branch block and a markedly prolonged QRS. An ICD indication is not automatically a CRT indication: arrhythmia protection and resynchronization solve different problems. [18]
Finish with three checks: What changed the filling or ejection? Did effective forward flow improve? Did the patient gain benefit without unacceptable pressure or congestion? Keep those questions separate from the longer-term treatment decision.
Put the physiology under pressure
These cases mix mechanisms, measurements and clinical decisions. Choose an answer before opening the explanations. Every option has a short reasoning path and a complete readable explanation.
Your place and answers stay on this page. These controls do not save account progress.
Case 1
Show answer and explanations for case 1
A. Stroke volume increased less than 1%; the pressure and oxygenation changes indicate limited tolerance (Best answer)
Prompt 1 of 2: predict, then reveal.
How much did ejection per beat change?
4,200/80 is 52.5 mL and 4,240/80 is 53 mL: an increase of approximately 0.95%.
What do the pressure and oxygenation findings add?
Higher wedge pressure with worsening oxygenation indicates a pressure cost and limited tolerance of the added filling.
Calculate recruited flow and assess its pressure cost separately.
Read the complete explanation
4,200/80 is 52.5 mL and 4,240/80 is 53 mL: an increase of approximately 0.95%. Higher wedge pressure with worsening oxygenation indicates a pressure cost and limited tolerance of the added filling.
B. Stroke volume increased less than 1%; the pressure and oxygenation changes indicate good tolerance (Why this does not fit)
Prompt 1 of 2: predict, then reveal.
How much did ejection per beat change?
The flow-per-beat calculation is correct: stroke volume rose by less than 1%.
What do the pressure and oxygenation findings add?
The tolerance conclusion is wrong: rising wedge pressure and worsening oxygenation argue against calling this well tolerated.
A small flow gain does not establish acceptable fluid tolerance.
Read the complete explanation
The flow-per-beat calculation is correct: stroke volume rose by less than 1%. The tolerance conclusion is wrong: rising wedge pressure and worsening oxygenation argue against calling this well tolerated.
C. Stroke volume increased approximately 11%; the pressure and oxygenation changes indicate limited tolerance (Why this does not fit)
Prompt 1 of 2: predict, then reveal.
How much did ejection per beat change?
Approximately 11% describes the EDV rise, not the stroke-volume rise; ejection increased only about 0.95%.
What do the pressure and oxygenation findings add?
Limited tolerance is supported by the pressure and oxygenation changes, but that does not correct the mistaken flow calculation.
Do not substitute the EDV percentage for the stroke-volume response.
Read the complete explanation
Approximately 11% describes the EDV rise, not the stroke-volume rise; ejection increased only about 0.95%. Limited tolerance is supported by the pressure and oxygenation changes, but that does not correct the mistaken flow calculation.
D. Stroke volume increased approximately 11%; the pressure and oxygenation changes indicate good tolerance (Why this does not fit)
Prompt 1 of 2: predict, then reveal.
How much did ejection per beat change?
EDV rose about 11%, whereas stroke volume rose less than 1%; those changes are not interchangeable.
What do the pressure and oxygenation findings add?
Worsening oxygenation and higher wedge pressure contradict the proposed good tolerance.
Both the flow calculation and the tolerance assessment must fit.
Read the complete explanation
EDV rose about 11%, whereas stroke volume rose less than 1%; those changes are not interchangeable. Worsening oxygenation and higher wedge pressure contradict the proposed good tolerance.
Takeaway: Calculate recruited flow and assess its pressure cost separately.
A. End-systolic volume increases; ejection fraction decreases (Why this does not fit)
Prompt 1 of 2: predict, then reveal.
Why might a larger residual seem plausible?
A larger starting volume can sometimes be accompanied by more residual blood.
What do these measurements require?
SV rises from about 83 to 120 mL, so ESV falls from about 42 to 30 mL. EF rises.
Calculate the residual volume instead of assuming that greater filling leaves more behind.
Read the complete explanation
A larger starting volume can sometimes be accompanied by more residual blood. SV rises from about 83 to 120 mL, so ESV falls from about 42 to 30 mL. EF rises.
B. End-systolic volume stays constant; ejection fraction increases (Why this does not fit)
Prompt 1 of 2: predict, then reveal.
What would a fixed residual volume predict?
At a constant ESV, the 25 mL EDV increase would add 25 mL to stroke volume.
How much did stroke volume actually increase?
It rose by approximately 37 mL. The extra ejection requires ESV to fall, not remain fixed.
Greater filling alone does not account for every exercise-related change in ejection.
Read the complete explanation
At a constant ESV, the 25 mL EDV increase would add 25 mL to stroke volume. It rose by approximately 37 mL. The extra ejection requires ESV to fall, not remain fixed.
C. End-systolic volume decreases; ejection fraction increases (Best answer)
Prompt 1 of 3: predict, then reveal.
What is ejected per cycle at rest and during exercise?
5,000/60 is about 83 mL; 18,000/150 is 120 mL.
How do those values change residual volume?
ESV is about 125 minus 83, or 42 mL, at rest and 150 minus 120, or 30 mL, during exercise.
What happens to the ejected fraction?
EF rises from approximately 67% to 80%. Integrated exercise physiology includes more filling and more complete emptying.
Use flow divided by rate, then subtract from EDV to locate what remains.
Read the complete explanation
5,000/60 is about 83 mL; 18,000/150 is 120 mL. ESV is about 125 minus 83, or 42 mL, at rest and 150 minus 120, or 30 mL, during exercise. EF rises from approximately 67% to 80%. Integrated exercise physiology includes more filling and more complete emptying.
D. End-systolic volume decreases; ejection fraction stays constant (Why this does not fit)
Prompt 1 of 2: predict, then reveal.
Can a smaller residual coexist with an unchanged EF?
It can if EDV and SV change in the appropriate proportion.
Are the fractions equal in this example?
No. About 83/125 is 67%, whereas 120/150 is 80%.
A smaller residual does not establish constant fractional ejection.
Read the complete explanation
It can if EDV and SV change in the appropriate proportion. No. About 83/125 is 67%, whereas 120/150 is 80%.
Takeaway: Use flow divided by rate, then subtract from EDV to locate what remains.
A. ESV 60 mL; the measurements isolate contractility (Why this does not fit)
Prompt 1 of 2: predict, then reveal.
What residual volume follows from the new measurements?
The new stroke volume is 70 mL, so the new EDV of 130 mL leaves an ESV of 60 mL.
Does unchanged wedge pressure hold loading constant?
The causal claim is wrong: EDV changed despite unchanged wedge pressure, so this is not an isolated contractility measurement.
A correct residual-volume calculation does not validate a causal claim.
Read the complete explanation
The new stroke volume is 70 mL, so the new EDV of 130 mL leaves an ESV of 60 mL. The causal claim is wrong: EDV changed despite unchanged wedge pressure, so this is not an isolated contractility measurement.
B. ESV 60 mL; the measurements do not isolate contractility (Best answer)
Prompt 1 of 2: predict, then reveal.
What residual volume follows from the new measurements?
The new stroke volume is 70 mL; subtracting it from the new EDV of 130 mL gives ESV 60 mL.
Does unchanged wedge pressure hold loading constant?
Unchanged wedge pressure does not hold EDV constant. The observed loading change prevents isolating contractility from this comparison.
Use simultaneous volumes and then examine the loading conditions.
Read the complete explanation
The new stroke volume is 70 mL; subtracting it from the new EDV of 130 mL gives ESV 60 mL. Unchanged wedge pressure does not hold EDV constant. The observed loading change prevents isolating contractility from this comparison.
C. ESV 80 mL; the measurements isolate contractility (Why this does not fit)
Prompt 1 of 2: predict, then reveal.
What residual volume follows from the new measurements?
ESV 80 mL incorrectly combines the old EDV of 150 mL with the new stroke volume of 70 mL.
Does unchanged wedge pressure hold loading constant?
Loading was not held constant: EDV fell, so an isolated contractility conclusion is also unsupported.
Do not mix measurements from different time points or assume load independence.
Read the complete explanation
ESV 80 mL incorrectly combines the old EDV of 150 mL with the new stroke volume of 70 mL. Loading was not held constant: EDV fell, so an isolated contractility conclusion is also unsupported.
D. ESV 80 mL; the measurements do not isolate contractility (Why this does not fit)
Prompt 1 of 2: predict, then reveal.
What residual volume follows from the new measurements?
The experimental limitation is valid, but the volume calculation is not: use new EDV 130 mL minus new SV 70 mL.
Does unchanged wedge pressure hold loading constant?
A constant pressure reading cannot erase the directly measured EDV change.
An appropriate caveat cannot rescue an incorrect ESV.
Read the complete explanation
The experimental limitation is valid, but the volume calculation is not: use new EDV 130 mL minus new SV 70 mL. A constant pressure reading cannot erase the directly measured EDV change.
Takeaway: Use simultaneous volumes and then examine the loading conditions.
What ejected volume must the follow-up pair reproduce?
The measured output and rate require SV 4,000/80 = 50 mL.
Does the proposed pair also reproduce the measured residual volume?
Adding ESV 60 mL gives EDV 110 mL; its ejected fraction is 50/110, approximately 45%. Both measurements fit.
Use measured flow and residual volume together to recover EDV and EF.
Read the complete explanation
The measured output and rate require SV 4,000/80 = 50 mL. Adding ESV 60 mL gives EDV 110 mL; its ejected fraction is 50/110, approximately 45%. Both measurements fit.
B. EDV 130 mL; EF approximately 38% (Why this does not fit)
Prompt 1 of 2: predict, then reveal.
What ejected volume must the follow-up pair reproduce?
An EDV of 130 mL at approximately 38% EF ejects about 50 mL, so it can match the measured flow.
Does the proposed pair also reproduce the measured residual volume?
It would leave about 80 mL rather than the measured ESV 60 mL. Matching flow alone does not establish the correct chamber volumes.
A flow-compatible pair can still leave the wrong residual volume.
Read the complete explanation
An EDV of 130 mL at approximately 38% EF ejects about 50 mL, so it can match the measured flow. It would leave about 80 mL rather than the measured ESV 60 mL. Matching flow alone does not establish the correct chamber volumes.
C. EDV 130 mL; EF approximately 54% (Why this does not fit)
Prompt 1 of 2: predict, then reveal.
What ejected volume must the follow-up pair reproduce?
At EDV 130 mL and approximately 54% EF, SV is about 70 mL, which would produce 5.6 rather than 4.0 L/min at 80/min.
Does the proposed pair also reproduce the measured residual volume?
The pair does leave approximately 60 mL, but matching residual volume alone cannot replace the contradictory flow measurement.
A residual-compatible pair can still require the wrong minute output.
Read the complete explanation
At EDV 130 mL and approximately 54% EF, SV is about 70 mL, which would produce 5.6 rather than 4.0 L/min at 80/min. The pair does leave approximately 60 mL, but matching residual volume alone cannot replace the contradictory flow measurement.
D. EDV 110 mL; EF approximately 54% (Why this does not fit)
Prompt 1 of 2: predict, then reveal.
What ejected volume must the follow-up pair reproduce?
The correct new EDV is 110 mL, but approximately 54% would eject about 60 mL rather than the measured 50 mL.
Does the proposed pair also reproduce the measured residual volume?
That pair leaves only about 50 mL, not ESV 60 mL. The fraction cannot be retained from the baseline contraction.
Keep the ejected fraction from the same contraction as its volumes.
Read the complete explanation
The correct new EDV is 110 mL, but approximately 54% would eject about 60 mL rather than the measured 50 mL. That pair leaves only about 50 mL, not ESV 60 mL. The fraction cannot be retained from the baseline contraction.
Takeaway: Use measured flow and residual volume together to recover EDV and EF.
A. SV 70 mL; EF approximately 41% (Why this does not fit)
Prompt 1 of 2: predict, then reveal.
Does the proposed stroke volume reproduce the measured output and rate?
At 80/min, SV 70 mL would produce 5.6 L/min, not the measured 4.8 L/min.
Does its fraction use the current measured EDV?
70/170 is approximately 41%, so this pair can match the current EDV but not the current minute output.
Consistency with EDV does not overrule the measured minute output.
Read the complete explanation
At 80/min, SV 70 mL would produce 5.6 L/min, not the measured 4.8 L/min. 70/170 is approximately 41%, so this pair can match the current EDV but not the current minute output.
B. SV 60 mL; EF approximately 31% (Why this does not fit)
Prompt 1 of 2: predict, then reveal.
Does the proposed stroke volume reproduce the measured output and rate?
SV 60 mL correctly matches 4,800/80.
Does its fraction use the current measured EDV?
Approximately 31% uses baseline EDV 195 mL. The current fraction is 60/170, approximately 35%.
An unchanged stroke volume can represent a different fraction after EDV changes.
Read the complete explanation
SV 60 mL correctly matches 4,800/80. Approximately 31% uses baseline EDV 195 mL. The current fraction is 60/170, approximately 35%.
C. SV 60 mL; EF approximately 35% (Best answer)
Prompt 1 of 2: predict, then reveal.
Does the proposed stroke volume reproduce the measured output and rate?
The measured output at the unchanged rate requires SV 60 mL.
Does its fraction use the current measured EDV?
Using current EDV 170 mL gives EF approximately 35%. Decongestion with preserved measured output does not independently establish myocardial recovery.
Recover stroke volume from flow, then calculate its fraction of current filling.
Read the complete explanation
The measured output at the unchanged rate requires SV 60 mL. Using current EDV 170 mL gives EF approximately 35%. Decongestion with preserved measured output does not independently establish myocardial recovery.
D. SV 70 mL; EF approximately 35% (Why this does not fit)
Prompt 1 of 2: predict, then reveal.
Does the proposed stroke volume reproduce the measured output and rate?
SV 70 mL does not fit the measured 4.8 L/min at 80/min; the required SV is 60 mL.
Does its fraction use the current measured EDV?
Approximately 35% is the correct current EF only when paired with SV 60 mL. The proposed 70 mL would instead represent about 41% of EDV.
Both the ejected amount and its fraction must fit the same measurements.
Read the complete explanation
SV 70 mL does not fit the measured 4.8 L/min at 80/min; the required SV is 60 mL. Approximately 35% is the correct current EF only when paired with SV 60 mL. The proposed 70 mL would instead represent about 41% of EDV.
Takeaway: Recover stroke volume from flow, then calculate its fraction of current filling.
A. A 20% decrease, because thicker myocardium lowers stress (Why this does not fit)
Prompt 1 of 2: predict, then reveal.
Why might a thicker wall reduce stress?
At a fixed radius and pressure, greater thickness lowers the stress carried per unit wall.
What was not fixed in this patient?
Radius increased by 50%, outweighing the 20% increase in thickness.
The wall-thickness effect must be considered together with the chamber-radius effect.
Read the complete explanation
At a fixed radius and pressure, greater thickness lowers the stress carried per unit wall. Radius increased by 50%, outweighing the 20% increase in thickness.
B. No change, because both radius and thickness increased (Why this does not fit)
Prompt 1 of 2: predict, then reveal.
When would radius and thickness cancel?
They cancel in this approximation if their ratio remains unchanged.
Did that ratio remain unchanged?
No. Radius divided by thickness increased from 3.0 to 3.75.
Parallel increases only cancel when their proportional changes are equal.
Read the complete explanation
They cancel in this approximation if their ratio remains unchanged. No. Radius divided by thickness increased from 3.0 to 3.75.
C. A 50% increase, because the radius increased by one half (Why this does not fit)
Prompt 1 of 2: predict, then reveal.
Why does 50% appear plausible?
Radius increased from 3.0 to 4.5 cm, a 50% rise.
Which accompanying change reduces that effect?
Wall thickness also increased by 20%; the combined ratio is 1.5/1.2, or 1.25.
Ignoring the change in thickness overestimates the geometric stress increase.
Read the complete explanation
Radius increased from 3.0 to 4.5 cm, a 50% rise. Wall thickness also increased by 20%; the combined ratio is 1.5/1.2, or 1.25.
D. A 25% increase, because radius increased more than thickness (Best answer)
Prompt 1 of 3: predict, then reveal.
What are the original and new geometry ratios?
The original radius/thickness ratio is 3.0/1.0 = 3. The new ratio is 4.5/1.2 = 3.75.
What is the proportional change?
3.75 divided by 3 is 1.25, a 25% increase.
Why is added thickness insufficient?
The cavity enlarged proportionally more than the wall thickened. The calculation describes geometry, not a direct measurement of diastolic compliance.
At comparable pressure, stress rises when the radius-to-thickness ratio rises.
Read the complete explanation
The original radius/thickness ratio is 3.0/1.0 = 3. The new ratio is 4.5/1.2 = 3.75. 3.75 divided by 3 is 1.25, a 25% increase. The cavity enlarged proportionally more than the wall thickened. The calculation describes geometry, not a direct measurement of diastolic compliance.
Takeaway: At comparable pressure, stress rises when the radius-to-thickness ratio rises.
A. Early SV 52.5 mL; later EF 45% (Why this does not fit)
Prompt 1 of 2: predict, then reveal.
What was ejected per beat at the one-week visit?
52.5 mL uses the old rate of 80/min with the new output. The one-week calculation is 4,200/70 = 60 mL.
What fraction was ejected at the four-month visit?
The later EF is correctly calculated as (140 - 77)/140 = 45%; this does not correct the earlier mixed-time calculation.
Keep rate and output from the same visit.
Read the complete explanation
52.5 mL uses the old rate of 80/min with the new output. The one-week calculation is 4,200/70 = 60 mL. The later EF is correctly calculated as (140 - 77)/140 = 45%; this does not correct the earlier mixed-time calculation.
B. Early SV 60 mL; later EF 55% (Why this does not fit)
Prompt 1 of 2: predict, then reveal.
What was ejected per beat at the one-week visit?
The one-week stroke volume is 4,200/70 = 60 mL, unchanged from baseline.
What fraction was ejected at the four-month visit?
77/140 is the fraction left behind, 55%. EF is the ejected fraction, 63/140 = 45%.
Distinguish the residual fraction from the ejected fraction.
Read the complete explanation
The one-week stroke volume is 4,200/70 = 60 mL, unchanged from baseline. 77/140 is the fraction left behind, 55%. EF is the ejected fraction, 63/140 = 45%.
C. Early SV 60 mL; later EF 45% (Best answer)
Prompt 1 of 2: predict, then reveal.
What was ejected per beat at the one-week visit?
One-week stroke volume is 4,200/70 = 60 mL; the lower early output accompanied a lower rate, not a measured stroke-volume decline.
What fraction was ejected at the four-month visit?
At four months, 140 - 77 = 63 mL is ejected, giving EF 45%. An early output change is not a substitute for later clinical assessment.
Interpret the early flow change separately from the later ventricular measurement.
Read the complete explanation
One-week stroke volume is 4,200/70 = 60 mL; the lower early output accompanied a lower rate, not a measured stroke-volume decline. At four months, 140 - 77 = 63 mL is ejected, giving EF 45%. An early output change is not a substitute for later clinical assessment.
D. Early SV 52.5 mL; later EF 55% (Why this does not fit)
Prompt 1 of 2: predict, then reveal.
What was ejected per beat at the one-week visit?
Use the one-week rate of 70/min, not the original 80/min: the stroke volume is 60 mL.
What fraction was ejected at the four-month visit?
55% is the residual-volume fraction; the ejected fraction is 45%. Both time-specific calculations must be corrected.
Neither mixed-time arithmetic nor a residual fraction measures EF.
Read the complete explanation
Use the one-week rate of 70/min, not the original 80/min: the stroke volume is 60 mL. 55% is the residual-volume fraction; the ejected fraction is 45%. Both time-specific calculations must be corrected.
Takeaway: Interpret the early flow change separately from the later ventricular measurement.
A. The elevated ventricular pressure reflects increased diastolic filling, favoring volume-load remodeling (Why this does not fit)
Prompt 1 of 2: predict, then reveal.
Why can increased filling change ventricular geometry?
Chronic volume loading can favor cavity enlargement.
Which phase and location identify the main measured load here?
The pressure difference occurs during systole across a stenotic outflow valve. It reflects an ejection load rather than measured increased EDV.
A systolic outflow pressure gradient is not a direct measure of diastolic filling.
Read the complete explanation
Chronic volume loading can favor cavity enlargement. The pressure difference occurs during systole across a stenotic outflow valve. It reflects an ejection load rather than measured increased EDV.
B. Aortic pressure determines the full systolic wall load, so the thickening must be unrelated (Why this does not fit)
Prompt 1 of 2: predict, then reveal.
Why is aortic pressure often considered when discussing afterload?
It is an important part of the pressure opposing ejection in an unobstructed system.
What makes it incomplete here?
The obstructed valve requires the ventricle to generate substantially higher pressure than the aorta.
Downstream arterial pressure can underestimate ventricular pressure when the outflow valve is obstructed.
Read the complete explanation
It is an important part of the pressure opposing ejection in an unobstructed system. The obstructed valve requires the ventricle to generate substantially higher pressure than the aorta.
C. The ventricle generates high upstream pressure, and wall thickening can reduce wall stress (Best answer)
Prompt 1 of 3: predict, then reveal.
Which pressure acts inside the contracting ventricle?
The measured ventricular pressure is 190 mm Hg, upstream of the stenotic valve.
How can a thicker wall partly compensate?
For comparable pressure and radius, added wall thickness reduces wall stress in a simplified geometric relationship.
Does compensation remove every consequence?
No. Pressure-load remodeling can coexist with impaired relaxation and a higher pressure cost of filling.
A stenotic outflow valve raises ventricular systolic load even when aortic pressure is not very high.
Read the complete explanation
The left ventricle generates the measured 190 mm Hg systolic pressure upstream of the obstructed valve, rather than only the 125 mm Hg aortic pressure. Greater wall thickness can reduce wall stress for a given pressure and radius without removing that pressure requirement. Wall thickening does not establish normal relaxation or a normal pressure cost of filling.
D. The thicker wall reduces the pressure needed to eject across the stenotic valve (Why this does not fit)
Prompt 1 of 2: predict, then reveal.
Why can a thicker wall be compensatory?
At a given pressure and radius, added thickness reduces stress per unit wall.
Does that eliminate the required upstream pressure?
No. The fixed outflow obstruction still requires the ventricle to generate a higher pressure than the aorta.
Wall thickening can lower wall stress without removing the valve pressure gradient.
Read the complete explanation
At a given pressure and radius, added thickness reduces stress per unit wall. No. The fixed outflow obstruction still requires the ventricle to generate a higher pressure than the aorta.
Takeaway: A stenotic outflow valve raises ventricular systolic load even when aortic pressure is not very high.
A. The BNP excludes a cardiac filling disorder; the exercise pressure is abnormal (Why this does not fit)
Prompt 1 of 2: predict, then reveal.
Does the resting peptide value exclude the suspected process in this patient?
A low BNP cannot reliably exclude HFpEF in a patient with obesity; that part of the interpretation overstates the test.
What does the symptom-linked exercise pressure show?
An exercise wedge pressure of 29 mm Hg is abnormal and supports an exercise-related filling-pressure limitation.
A correct pressure interpretation does not make low BNP exclusionary.
Read the complete explanation
A low BNP cannot reliably exclude HFpEF in a patient with obesity; that part of the interpretation overstates the test. An exercise wedge pressure of 29 mm Hg is abnormal and supports an exercise-related filling-pressure limitation.
B. The BNP does not exclude a cardiac filling disorder; the exercise pressure is normal (Why this does not fit)
Prompt 1 of 2: predict, then reveal.
Does the resting peptide value exclude the suspected process in this patient?
The BNP limitation is correctly recognized: obesity can lower measured natriuretic peptide concentrations.
What does the symptom-linked exercise pressure show?
The exercise result is not normal: mean wedge pressure reaches 29 mm Hg while the characteristic symptoms occur.
Recognize both peptide limitations and exercise hemodynamics.
Read the complete explanation
The BNP limitation is correctly recognized: obesity can lower measured natriuretic peptide concentrations. The exercise result is not normal: mean wedge pressure reaches 29 mm Hg while the characteristic symptoms occur.
C. The BNP excludes a cardiac filling disorder; the exercise pressure is normal (Why this does not fit)
Prompt 1 of 2: predict, then reveal.
Does the resting peptide value exclude the suspected process in this patient?
Obesity limits the exclusionary value of the low BNP, so a cardiac filling disorder is not ruled out.
What does the symptom-linked exercise pressure show?
A mean exercise wedge pressure of 29 mm Hg is abnormal; preserved resting EF does not make that response normal.
Resting EF and BNP cannot overrule abnormal exercise filling pressure.
Read the complete explanation
Obesity limits the exclusionary value of the low BNP, so a cardiac filling disorder is not ruled out. A mean exercise wedge pressure of 29 mm Hg is abnormal; preserved resting EF does not make that response normal.
D. The BNP does not exclude a cardiac filling disorder; the exercise pressure is abnormal (Best answer)
Prompt 1 of 2: predict, then reveal.
Does the resting peptide value exclude the suspected process in this patient?
A low resting BNP does not exclude HFpEF in obesity; the discordant clinical evidence must still be assessed.
What does the symptom-linked exercise pressure show?
Symptom-linked exercise wedge pressure of 29 mm Hg meets the abnormal exercise-pressure criterion and supports a filling-pressure limitation.
Integrate the low-peptide limitation with the measured exercise abnormality.
Read the complete explanation
A low resting BNP does not exclude HFpEF in obesity; the discordant clinical evidence must still be assessed. Symptom-linked exercise wedge pressure of 29 mm Hg meets the abnormal exercise-pressure criterion and supports a filling-pressure limitation.
Takeaway: Integrate the low-peptide limitation with the measured exercise abnormality.
How much blood is ejected per cycle at the new rate?
New SV is 3,850/70 = 55 mL, so its calculation is correct.
How much remains after that ejection from the new EDV?
New ESV is 150 - 55 = 95 mL. The proposed 80 mL retains the old 70 mL SV when subtracting from the new EDV.
A correct SV must be subtracted from the current EDV.
Read the complete explanation
New SV is 3,850/70 = 55 mL, so its calculation is correct. New ESV is 150 - 55 = 95 mL. The proposed 80 mL retains the old 70 mL SV when subtracting from the new EDV.
B. SV 70 mL; ESV 95 mL (Why this does not fit)
Prompt 1 of 2: predict, then reveal.
How much blood is ejected per cycle at the new rate?
70 mL was the baseline SV. The new output and rate require 55 mL.
How much remains after that ejection from the new EDV?
New ESV 95 mL is correct only with that 55 mL SV, not the proposed 70 mL.
Keep the ejected and residual volumes internally consistent.
Read the complete explanation
70 mL was the baseline SV. The new output and rate require 55 mL. New ESV 95 mL is correct only with that 55 mL SV, not the proposed 70 mL.
C. SV 55 mL; ESV 95 mL (Best answer)
Prompt 1 of 2: predict, then reveal.
How much blood is ejected per cycle at the new rate?
The follow-up stroke volume is 3,850/70 = 55 mL, lower than the original 70 mL.
How much remains after that ejection from the new EDV?
Subtracting 55 mL from EDV 150 mL leaves ESV 95 mL. The observed higher arterial pressure is consistent with greater opposing load, not proof of increased contractility.
Derive flow per cycle, then distinguish starting volume from residual volume.
Read the complete explanation
The follow-up stroke volume is 3,850/70 = 55 mL, lower than the original 70 mL. Subtracting 55 mL from EDV 150 mL leaves ESV 95 mL. The observed higher arterial pressure is consistent with greater opposing load, not proof of increased contractility.
D. SV 70 mL; ESV 80 mL (Why this does not fit)
Prompt 1 of 2: predict, then reveal.
How much blood is ejected per cycle at the new rate?
The lower rate alone is insufficient: preserving SV 70 mL at 70/min would give output 4.9 L/min, not 3.85 L/min.
How much remains after that ejection from the new EDV?
Using the actual 55 mL SV gives ESV 95 mL. The pair 70/80 uses the new EDV but ignores the measured reduction in ejection.
Greater filling does not force greater ejection when the opposing load changes.
Read the complete explanation
The lower rate alone is insufficient: preserving SV 70 mL at 70/min would give output 4.9 L/min, not 3.85 L/min. Using the actual 55 mL SV gives ESV 95 mL. The pair 70/80 uses the new EDV but ignores the measured reduction in ejection.
Takeaway: Derive flow per cycle, then distinguish starting volume from residual volume.
A. Follow-up EDV 120 mL; EDV fell by 20 mL (Best answer)
Prompt 1 of 2: predict, then reveal.
What is the follow-up stroke volume and corresponding EDV?
After blood removal, SV is 5,400/90 = 60 mL; at EF 50%, EDV is 60/0.50 = 120 mL.
How does that volume compare with baseline?
Baseline SV is 5,600/80 = 70 mL and EDV is 140 mL. Thus EDV fell 20 mL despite the smaller change in minute output.
Use output, rate and EF to recover filling volume.
Read the complete explanation
After blood removal, SV is 5,400/90 = 60 mL; at EF 50%, EDV is 60/0.50 = 120 mL. Baseline SV is 5,600/80 = 70 mL and EDV is 140 mL. Thus EDV fell 20 mL despite the smaller change in minute output.
B. Follow-up EDV 120 mL; EDV fell by 10 mL (Why this does not fit)
Prompt 1 of 2: predict, then reveal.
What is the follow-up stroke volume and corresponding EDV?
The follow-up EDV of 120 mL is correct, after converting minute output to stroke volume and applying EF.
How does that volume compare with baseline?
Ten milliliters is the stroke-volume decrease, not the EDV decrease; baseline EDV was 140 mL.
Keep a change in ejected volume separate from a change in EDV.
Read the complete explanation
The follow-up EDV of 120 mL is correct, after converting minute output to stroke volume and applying EF. Ten milliliters is the stroke-volume decrease, not the EDV decrease; baseline EDV was 140 mL.
C. Follow-up EDV 60 mL; EDV fell by 20 mL (Why this does not fit)
Prompt 1 of 2: predict, then reveal.
What is the follow-up stroke volume and corresponding EDV?
Sixty milliliters is the follow-up stroke volume. Because it is only half of EDV, the starting ventricular volume is 120 mL.
How does that volume compare with baseline?
The EDV decrease is 20 mL, but that correct difference cannot rescue the incorrect final volume.
A correct difference does not identify the correct physiological volume.
Read the complete explanation
Sixty milliliters is the follow-up stroke volume. Because it is only half of EDV, the starting ventricular volume is 120 mL. The EDV decrease is 20 mL, but that correct difference cannot rescue the incorrect final volume.
D. Follow-up EDV 60 mL; EDV fell by 10 mL (Why this does not fit)
Prompt 1 of 2: predict, then reveal.
What is the follow-up stroke volume and corresponding EDV?
Do not relabel the follow-up 60 mL ejected volume as EDV; EF 50% requires EDV 120 mL.
How does that volume compare with baseline?
The 10 mL reduction describes stroke volume. EDV falls from 140 to 120 mL, a 20 mL change.
Convert both stroke volume and its fraction before comparing filling.
Read the complete explanation
Do not relabel the follow-up 60 mL ejected volume as EDV; EF 50% requires EDV 120 mL. The 10 mL reduction describes stroke volume. EDV falls from 140 to 120 mL, a 20 mL change.
Takeaway: Use output, rate and EF to recover filling volume.
A. Cardiac output is unchanged; systemic resistance is unchanged (Why this does not fit)
Prompt 1 of 2: predict, then reveal.
Did the rate increase restore minute output?
Baseline output is 80 x 70 = 5.6 L/min; the final output is 84 x 50 = 4.2 L/min, so output is not unchanged.
What resistance is required by the recovered pressure difference?
With the same 80 mm Hg driving pressure and less flow, calculated systemic resistance must rise rather than remain fixed.
Restored pressure is not proof of restored flow.
Read the complete explanation
Baseline output is 80 x 70 = 5.6 L/min; the final output is 84 x 50 = 4.2 L/min, so output is not unchanged. With the same 80 mm Hg driving pressure and less flow, calculated systemic resistance must rise rather than remain fixed.
B. Cardiac output is lower; systemic resistance is approximately one third higher (Best answer)
Prompt 1 of 2: predict, then reveal.
Did the rate increase restore minute output?
Output falls from 5.6 to 4.2 L/min; the slightly faster rate does not offset the smaller stroke volume.
What resistance is required by the recovered pressure difference?
Resistance changes from 80/5.6 to 80/4.2, a ratio of 4/3. Pressure recovery therefore coexists with lower flow and higher resistance.
Calculate flow first, then the resistance supporting pressure.
Read the complete explanation
Output falls from 5.6 to 4.2 L/min; the slightly faster rate does not offset the smaller stroke volume. Resistance changes from 80/5.6 to 80/4.2, a ratio of 4/3. Pressure recovery therefore coexists with lower flow and higher resistance.
C. Cardiac output is lower; systemic resistance is unchanged (Why this does not fit)
Prompt 1 of 2: predict, then reveal.
Did the rate increase restore minute output?
The output decrease is correctly identified: 4.2 L/min is below the original 5.6 L/min.
What resistance is required by the recovered pressure difference?
Unchanged resistance would not sustain the same pressure difference at lower flow; the resistance ratio is 4/3.
A correct flow calculation still requires a consistent pressure-flow interpretation.
Read the complete explanation
The output decrease is correctly identified: 4.2 L/min is below the original 5.6 L/min. Unchanged resistance would not sustain the same pressure difference at lower flow; the resistance ratio is 4/3.
D. Cardiac output is unchanged; systemic resistance is approximately one third higher (Why this does not fit)
Prompt 1 of 2: predict, then reveal.
Did the rate increase restore minute output?
The final rate and stroke volume give 4.2 L/min, not the original 5.6 L/min.
What resistance is required by the recovered pressure difference?
The calculated one-third resistance increase is correct, but the paired unchanged-output claim is not.
Do not discard the measured stroke-volume change when assessing compensation.
Read the complete explanation
The final rate and stroke volume give 4.2 L/min, not the original 5.6 L/min. The calculated one-third resistance increase is correct, but the paired unchanged-output claim is not.
Takeaway: Calculate flow first, then the resistance supporting pressure.
A. Mineralocorticoid receptor antagonism; a more negative lumen promotes potassium secretion (Why this does not fit)
Prompt 1 of 2: predict, then reveal.
Which target fits the transcription and isolated-channel observations?
Reduced aldosterone-dependent transcription without direct isolated-channel inhibition fits receptor antagonism rather than direct channel blockade.
How does reduced electrogenic sodium uptake affect potassium secretion?
Reduced electrogenic sodium uptake makes the lumen less negative, decreasing the driving force for potassium secretion rather than promoting it.
Identify the receptor effect without reversing its renal consequence.
Read the complete explanation
Reduced aldosterone-dependent transcription without direct isolated-channel inhibition fits receptor antagonism rather than direct channel blockade. Reduced electrogenic sodium uptake makes the lumen less negative, decreasing the driving force for potassium secretion rather than promoting it.
B. Direct epithelial sodium-channel blockade; a less negative lumen reduces potassium secretion (Why this does not fit)
Prompt 1 of 2: predict, then reveal.
Which target fits the transcription and isolated-channel observations?
The reduced potassium secretion is plausible, but direct channel blockade should affect isolated-channel current; the experiment instead implicates aldosterone signaling.
How does reduced electrogenic sodium uptake affect potassium secretion?
Less electrogenic sodium uptake reduces lumen negativity and potassium secretion, explaining potassium retention without a GFR change.
A shared potassium effect does not make receptor and channel targets interchangeable.
Read the complete explanation
The reduced potassium secretion is plausible, but direct channel blockade should affect isolated-channel current; the experiment instead implicates aldosterone signaling. Less electrogenic sodium uptake reduces lumen negativity and potassium secretion, explaining potassium retention without a GFR change.
C. Mineralocorticoid receptor antagonism; a less negative lumen reduces potassium secretion (Best answer)
Prompt 1 of 2: predict, then reveal.
Which target fits the transcription and isolated-channel observations?
The transcriptional response and absent direct channel inhibition point to antagonism of aldosterone signaling at the mineralocorticoid receptor.
How does reduced electrogenic sodium uptake affect potassium secretion?
Reduced electrogenic sodium reabsorption makes the lumen less negative and reduces potassium secretion, consistent with the observed potassium increase.
Link the inferred signaling target to the electrical drive for potassium loss.
Read the complete explanation
The transcriptional response and absent direct channel inhibition point to antagonism of aldosterone signaling at the mineralocorticoid receptor. Reduced electrogenic sodium reabsorption makes the lumen less negative and reduces potassium secretion, consistent with the observed potassium increase.
D. Direct epithelial sodium-channel blockade; a more negative lumen promotes potassium secretion (Why this does not fit)
Prompt 1 of 2: predict, then reveal.
Which target fits the transcription and isolated-channel observations?
Direct channel blockade does not match the intact isolated-channel current and reduced aldosterone-dependent transcription.
How does reduced electrogenic sodium uptake affect potassium secretion?
The proposed increase in lumen negativity reverses the expected electrical effect; sodium uptake and the drive for potassium secretion fall.
Both the molecular target and the direction of potassium transport must fit.
Read the complete explanation
Direct channel blockade does not match the intact isolated-channel current and reduced aldosterone-dependent transcription. The proposed increase in lumen negativity reverses the expected electrical effect; sodium uptake and the drive for potassium secretion fall.
Takeaway: Link the inferred signaling target to the electrical drive for potassium loss.
A. No meaningful preload response; the bedside findings support current hypoperfusion (Why this does not fit)
Prompt 1 of 2: predict, then reveal.
How large is the reversible flow response?
The flow rise is 0.6/4.8 = 12.5% at unchanged rate, supporting responsiveness under these test conditions.
Do the supplied clinical findings establish inadequate perfusion?
Alertness, warm perfusion, short refill, normal lactate and maintained urine output do not support the proposed current hypoperfusion.
Do not confuse a positive response with evidence of a perfusion deficit.
Read the complete explanation
The flow rise is 0.6/4.8 = 12.5% at unchanged rate, supporting responsiveness under these test conditions. Alertness, warm perfusion, short refill, normal lactate and maintained urine output do not support the proposed current hypoperfusion.
B. A preload response is present; the bedside findings do not support current hypoperfusion (Best answer)
Prompt 1 of 2: predict, then reveal.
How large is the reversible flow response?
A reversible 12.5% flow increase supports preload responsiveness under the stated measurement conditions.
Do the supplied clinical findings establish inadequate perfusion?
The clinical findings do not establish current hypoperfusion. Responsiveness alone therefore does not establish a need for additional fluid.
Use the maneuver to assess response and clinical findings to assess need.
Read the complete explanation
A reversible 12.5% flow increase supports preload responsiveness under the stated measurement conditions. The clinical findings do not establish current hypoperfusion. Responsiveness alone therefore does not establish a need for additional fluid.
C. A preload response is present; the bedside findings support current hypoperfusion (Why this does not fit)
Prompt 1 of 2: predict, then reveal.
How large is the reversible flow response?
The positive response is correctly identified from the reversible 12.5% increase.
Do the supplied clinical findings establish inadequate perfusion?
The perfusion conclusion is wrong: the supplied examination, lactate and urine output do not support current hypoperfusion.
A positive fluid-response test does not turn adequate perfusion into shock.
Read the complete explanation
The positive response is correctly identified from the reversible 12.5% increase. The perfusion conclusion is wrong: the supplied examination, lactate and urine output do not support current hypoperfusion.
D. No meaningful preload response; the bedside findings do not support current hypoperfusion (Why this does not fit)
Prompt 1 of 2: predict, then reveal.
How large is the reversible flow response?
The adequate-perfusion assessment is supported, but the response is not absent: flow increases reproducibly by 12.5%.
Do the supplied clinical findings establish inadequate perfusion?
Maintained perfusion and a positive response can coexist; the two questions must be assessed separately.
Adequate perfusion does not imply absent preload responsiveness.
Read the complete explanation
The adequate-perfusion assessment is supported, but the response is not absent: flow increases reproducibly by 12.5%. Maintained perfusion and a positive response can coexist; the two questions must be assessed separately.
Takeaway: Use the maneuver to assess response and clinical findings to assess need.
A. Normal relaxation produces brisk early inflow, while Valsalva predominantly reduces the atrial wave (Why this does not fit)
Prompt 1 of 2: predict, then reveal.
Why might a ratio near one look normal?
Early and atrial inflow can have similar amplitudes in a normal filling pattern.
Which findings favor a different interpretation?
Reduced annular relaxation velocities, atrial enlargement and a large fall in E/A with reduced filling support impaired relaxation masked by elevated atrial pressure.
Interpret the E/A response alongside evidence of impaired relaxation.
Read the complete explanation
Early and atrial inflow can have similar amplitudes in a normal filling pattern. Reduced annular relaxation velocities, atrial enlargement and a large fall in E/A with reduced filling support impaired relaxation masked by elevated atrial pressure.
B. Higher atrial pressure supported early filling despite impaired ventricular relaxation (Best answer)
Prompt 1 of 3: predict, then reveal.
What does the tissue-motion information suggest?
Reduced annular early diastolic velocities support impaired relaxation in this clinical context.
How can early inflow nevertheless remain substantial?
An elevated atrial pressure can increase the early transmitral driving pressure, making E/A appear less abnormal.
Why does Valsalva help reveal the pattern?
Reducing filling during the maneuver lowers that contribution; the greater than 50% E/A reduction supports elevated baseline filling pressure.
A normal-looking inflow ratio can conceal impaired relaxation when atrial pressure is elevated.
Read the complete explanation
Reduced annular early diastolic velocities support impaired relaxation in this clinical context. An elevated atrial pressure can increase the early transmitral driving pressure, making E/A appear less abnormal. Reducing filling during the maneuver lowers that contribution; the greater than 50% E/A reduction supports elevated baseline filling pressure.
C. Impaired relaxation with normal atrial pressure is sufficient to explain the initially preserved early inflow (Why this does not fit)
Prompt 1 of 2: predict, then reveal.
What does impaired relaxation tend to do to early filling?
It can reduce the early transmitral filling contribution.
Why does normal atrial pressure not best fit the complete case?
Other measurements support elevated filling pressure, and reducing filling unmasks a much lower E/A ratio. Increased atrial pressure had supported early inflow.
Impaired relaxation and elevated atrial pressure can offset one another in the inflow pattern.
Read the complete explanation
It can reduce the early transmitral filling contribution. Other measurements support elevated filling pressure, and reducing filling unmasks a much lower E/A ratio. Increased atrial pressure had supported early inflow.
D. Greater atrial contractile force is the main cause of the initially maintained early-filling wave (Why this does not fit)
Prompt 1 of 2: predict, then reveal.
Which component of transmitral filling follows atrial contraction?
The A wave represents filling associated with atrial contraction.
What supports the early E wave despite impaired relaxation here?
Higher atrial pressure increases the early transmitral driving pressure; stronger atrial contraction is not the explanation for that early wave.
Atrial contraction produces the A wave, not the early E wave.
Read the complete explanation
The A wave represents filling associated with atrial contraction. Higher atrial pressure increases the early transmitral driving pressure; stronger atrial contraction is not the explanation for that early wave.
Takeaway: A normal-looking inflow ratio can conceal impaired relaxation when atrial pressure is elevated.
A. EDV 120 mL; renal loss has reduced total circulating volume (Why this does not fit)
Prompt 1 of 2: predict, then reveal.
What EDV follows from the new output, rate and EF?
New SV is 4,200/70 = 60 mL and EDV is 60/0.50 = 120 mL, so the numerical part is correct.
Does the volume evidence support fluid loss or redistribution?
No meaningful urine loss and unchanged measured blood volume contradict renal volume removal; redistribution can reduce central filling without reducing the total.
A correct ventricular volume does not support a contradicted loss mechanism.
Read the complete explanation
New SV is 4,200/70 = 60 mL and EDV is 60/0.50 = 120 mL, so the numerical part is correct. No meaningful urine loss and unchanged measured blood volume contradict renal volume removal; redistribution can reduce central filling without reducing the total.
B. EDV 140 mL; increased venous capacitance has redistributed circulating volume (Why this does not fit)
Prompt 1 of 2: predict, then reveal.
What EDV follows from the new output, rate and EF?
140 mL was the baseline EDV. The new measurements require 120 mL after converting output to SV and applying EF.
Does the volume evidence support fluid loss or redistribution?
Increased venous capacitance is consistent with reduced central filling at unchanged total volume, but the EDV calculation is wrong.
Keep baseline and follow-up filling volumes separate.
Read the complete explanation
140 mL was the baseline EDV. The new measurements require 120 mL after converting output to SV and applying EF. Increased venous capacitance is consistent with reduced central filling at unchanged total volume, but the EDV calculation is wrong.
C. EDV 140 mL; renal loss has reduced total circulating volume (Why this does not fit)
Prompt 1 of 2: predict, then reveal.
What EDV follows from the new output, rate and EF?
The follow-up EDV is 120 mL, not the baseline 140 mL.
Does the volume evidence support fluid loss or redistribution?
The preserved total circulating volume and absent diuresis argue against renal loss as the cause of the early change.
Both the calculated EDV and the proposed volume mechanism must match.
Read the complete explanation
The follow-up EDV is 120 mL, not the baseline 140 mL. The preserved total circulating volume and absent diuresis argue against renal loss as the cause of the early change.
D. EDV 120 mL; increased venous capacitance has redistributed circulating volume (Best answer)
Prompt 1 of 2: predict, then reveal.
What EDV follows from the new output, rate and EF?
The new stroke volume is 60 mL; EF 50% requires EDV 120 mL rather than the baseline 140 mL.
Does the volume evidence support fluid loss or redistribution?
Unchanged total blood volume with reduced central filling supports redistribution through increased venous capacitance, not renal fluid removal.
Recover the ventricular volume and then distinguish redistribution from loss.
Read the complete explanation
The new stroke volume is 60 mL; EF 50% requires EDV 120 mL rather than the baseline 140 mL. Unchanged total blood volume with reduced central filling supports redistribution through increased venous capacitance, not renal fluid removal.
Takeaway: Recover the ventricular volume and then distinguish redistribution from loss.
A. Output 6.0 L/min; relief of vena caval compression improves venous return (Why this does not fit)
Prompt 1 of 2: predict, then reveal.
What output follows from the lateral-position measurements?
6.0 L/min is the supine output. Later SV is 150 x 0.50 = 75 mL, giving 75 x 90/1,000 = 6.75 L/min.
Which mechanism explains the reproducible positional increase in filling?
Relief of vena caval compression by the gravid uterus fits the rapid positional filling change without added fluid.
Use the new position-specific measurements rather than the original output.
Read the complete explanation
6.0 L/min is the supine output. Later SV is 150 x 0.50 = 75 mL, giving 75 x 90/1,000 = 6.75 L/min. Relief of vena caval compression by the gravid uterus fits the rapid positional filling change without added fluid.
B. Output 6.75 L/min; relief of vena caval compression improves venous return (Best answer)
Prompt 1 of 2: predict, then reveal.
What output follows from the lateral-position measurements?
Lateral-position SV is 75 mL, so cardiac output is 6.75 L/min despite the lower rate.
Which mechanism explains the reproducible positional increase in filling?
The late-pregnancy positional pattern supports relief of vena caval compression and improved venous return, not an isolated change in inotropy.
A slower rate can coexist with greater output when improved return recruits stroke volume.
Read the complete explanation
Lateral-position SV is 75 mL, so cardiac output is 6.75 L/min despite the lower rate. The late-pregnancy positional pattern supports relief of vena caval compression and improved venous return, not an isolated change in inotropy.
C. Output 6.0 L/min; an isolated positive inotropic effect explains the filling change (Why this does not fit)
Prompt 1 of 2: predict, then reveal.
What output follows from the lateral-position measurements?
The later EDV and EF yield SV 75 mL and output 6.75 L/min, not the initial 6.0 L/min.
Which mechanism explains the reproducible positional increase in filling?
An isolated inotropic explanation does not account for the reproducible position-linked filling increase without added fluid.
Both the flow calculation and the positional mechanism need evidence.
Read the complete explanation
The later EDV and EF yield SV 75 mL and output 6.75 L/min, not the initial 6.0 L/min. An isolated inotropic explanation does not account for the reproducible position-linked filling increase without added fluid.
D. Output 6.75 L/min; an isolated positive inotropic effect explains the filling change (Why this does not fit)
Prompt 1 of 2: predict, then reveal.
What output follows from the lateral-position measurements?
The output calculation is correct: 75 mL per beat at 90/min is 6.75 L/min.
Which mechanism explains the reproducible positional increase in filling?
The mechanistic claim is not: the rapid positional response supports relief of a venous-return obstruction rather than isolated positive inotropy.
A correct output does not identify an isolated contractility change.
Read the complete explanation
The output calculation is correct: 75 mL per beat at 90/min is 6.75 L/min. The mechanistic claim is not: the rapid positional response supports relief of a venous-return obstruction rather than isolated positive inotropy.
Takeaway: A slower rate can coexist with greater output when improved return recruits stroke volume.
A. New congestion is supported; faster neprilysin-mediated NT-proBNP degradation explains the fall (Why this does not fit)
Prompt 1 of 2: predict, then reveal.
Does the clinical course support new congestion despite the BNP rise?
Improved symptoms and reduced edema without renal deterioration do not support new congestion; the BNP rise must be interpreted in the drug context.
Can the NT-proBNP decline be assigned to accelerated neprilysin breakdown?
NT-proBNP is not cleared by neprilysin in the same way as BNP. Its decline cannot be explained by accelerated degradation through that inhibited enzyme.
Neither an isolated BNP rise nor an incorrect clearance mechanism establishes deterioration.
Read the complete explanation
Improved symptoms and reduced edema without renal deterioration do not support new congestion; the BNP rise must be interpreted in the drug context. NT-proBNP is not cleared by neprilysin in the same way as BNP. Its decline cannot be explained by accelerated degradation through that inhibited enzyme.
B. New congestion is not supported; reduced NT-proBNP release is consistent with reduced cardiac wall stress (Best answer)
Prompt 1 of 2: predict, then reveal.
Does the clinical course support new congestion despite the BNP rise?
Improved symptoms, reduced edema and stable kidney function do not support new congestion despite the isolated BNP rise.
Can the NT-proBNP decline be assigned to accelerated neprilysin breakdown?
NT-proBNP is not a neprilysin substrate in the same way as BNP; lower release with reduced wall stress is consistent with its decline and the clinical improvement.
Reconcile clinical congestion evidence with the distinct handling of the two peptides.
Read the complete explanation
Improved symptoms, reduced edema and stable kidney function do not support new congestion despite the isolated BNP rise. NT-proBNP is not a neprilysin substrate in the same way as BNP; lower release with reduced wall stress is consistent with its decline and the clinical improvement.
C. New congestion is supported; reduced NT-proBNP release is consistent with reduced cardiac wall stress (Why this does not fit)
Prompt 1 of 2: predict, then reveal.
Does the clinical course support new congestion despite the BNP rise?
The proposed new congestion conflicts with the improved symptoms and reduced edema in the stem.
Can the NT-proBNP decline be assigned to accelerated neprilysin breakdown?
The NT-proBNP interpretation is reasonable, but that does not validate the incorrect congestion conclusion.
A plausible marker mechanism does not outweigh the measured clinical course.
Read the complete explanation
The proposed new congestion conflicts with the improved symptoms and reduced edema in the stem. The NT-proBNP interpretation is reasonable, but that does not validate the incorrect congestion conclusion.
D. New congestion is not supported; faster neprilysin-mediated NT-proBNP degradation explains the fall (Why this does not fit)
Prompt 1 of 2: predict, then reveal.
Does the clinical course support new congestion despite the BNP rise?
The clinical interpretation is appropriate: the supplied course does not support new congestion.
Can the NT-proBNP decline be assigned to accelerated neprilysin breakdown?
The mechanism is wrong: neprilysin inhibition does not accelerate NT-proBNP breakdown; reduced release is consistent with the overall improvement.
A correct clinical conclusion still needs a correct biomarker mechanism.
Read the complete explanation
The clinical interpretation is appropriate: the supplied course does not support new congestion. The mechanism is wrong: neprilysin inhibition does not accelerate NT-proBNP breakdown; reduced release is consistent with the overall improvement.
Takeaway: Reconcile clinical congestion evidence with the distinct handling of the two peptides.
A. Transmural pressure 13 mm Hg; venous-return driving pressure 10 mm Hg (Why this does not fit)
Prompt 1 of 2: predict, then reveal.
Which pressure difference distends the atrial wall?
13 mm Hg adds atrial and surrounding pressure. The distending difference is 10 - 3 = 7 mm Hg.
Which pressure difference drives systemic venous return?
The venous-return gradient is correctly identified as 20 - 10 = 10 mm Hg; it uses right atrial, not pericardial, pressure downstream.
Distending pressure is a difference across a wall, not a sum.
Read the complete explanation
13 mm Hg adds atrial and surrounding pressure. The distending difference is 10 - 3 = 7 mm Hg. The venous-return gradient is correctly identified as 20 - 10 = 10 mm Hg; it uses right atrial, not pericardial, pressure downstream.
B. Transmural pressure 7 mm Hg; venous-return driving pressure 17 mm Hg (Why this does not fit)
Prompt 1 of 2: predict, then reveal.
Which pressure difference distends the atrial wall?
The transmural calculation is correct: right atrial minus surrounding pressure is 7 mm Hg.
Which pressure difference drives systemic venous return?
17 mm Hg subtracts pericardial pressure from mean systemic filling pressure. The venous-return downstream pressure is right atrial pressure, giving 10 mm Hg.
Do not use pericardial pressure as the downstream venous pressure.
Read the complete explanation
The transmural calculation is correct: right atrial minus surrounding pressure is 7 mm Hg. 17 mm Hg subtracts pericardial pressure from mean systemic filling pressure. The venous-return downstream pressure is right atrial pressure, giving 10 mm Hg.
C. Transmural pressure 7 mm Hg; venous-return driving pressure 10 mm Hg (Best answer)
Prompt 1 of 2: predict, then reveal.
Which pressure difference distends the atrial wall?
Atrial distension depends on 10 - 3 = 7 mm Hg across the wall, compared with 2 mm Hg before decompression.
Which pressure difference drives systemic venous return?
Venous return is driven by 20 - 10 = 10 mm Hg between the systemic reservoir and right atrium, compared with 4 mm Hg before decompression.
Keep wall distension and reservoir-to-atrium flow gradients separate.
Read the complete explanation
Atrial distension depends on 10 - 3 = 7 mm Hg across the wall, compared with 2 mm Hg before decompression. Venous return is driven by 20 - 10 = 10 mm Hg between the systemic reservoir and right atrium, compared with 4 mm Hg before decompression.
D. Transmural pressure 13 mm Hg; venous-return driving pressure 17 mm Hg (Why this does not fit)
Prompt 1 of 2: predict, then reveal.
Which pressure difference distends the atrial wall?
For wall distension, subtract surrounding pressure; do not add it. The correct value is 7 mm Hg.
Which pressure difference drives systemic venous return?
For venous return, subtract right atrial pressure from mean systemic filling pressure. The correct gradient is 10 mm Hg, not 17 mm Hg.
Each physiological question requires its own correctly chosen pressure pair.
Read the complete explanation
For wall distension, subtract surrounding pressure; do not add it. The correct value is 7 mm Hg. For venous return, subtract right atrial pressure from mean systemic filling pressure. The correct gradient is 10 mm Hg, not 17 mm Hg.
Takeaway: Keep wall distension and reservoir-to-atrium flow gradients separate.
A. Give repeated boluses until passive leg raising no longer increases stroke volume (Why this does not fit)
Prompt 1 of 2: predict, then reveal.
Why does the positive test suggest potential benefit from more filling?
It shows that additional central filling can recruit stroke volume under the tested conditions.
What makes repeated boluses a poor automatic response?
Pulmonary edema and oxygen needs are worsening, so fluid tolerance is limited even though the patient remains responsive.
Loss of responsiveness is not a mandatory endpoint for fluid administration.
Read the complete explanation
A positive passive leg raise shows that additional central filling can recruit stroke volume under the tested conditions. Pulmonary edema and oxygen needs are worsening, so fluid tolerance is limited even though the patient remains responsive.
B. Wait for lactate normalization before addressing the persistent low arterial pressure (Why this does not fit)
Prompt 1 of 2: predict, then reveal.
Why monitor lactate and other perfusion measures?
They help assess the course of shock and response to treatment.
Why is waiting inappropriate in this scenario?
The patient has persistent hypotension and delayed refill; lactate normalization is not a prerequisite to addressing vascular tone.
A resuscitation marker should not postpone treatment of ongoing circulatory failure.
Read the complete explanation
Serial perfusion measurements help assess the course of shock and response to treatment. The patient has persistent hypotension and delayed refill; lactate normalization is not a prerequisite to addressing vascular tone.
C. Start norepinephrine while reassessing perfusion and congestion rather than automatically repeating fluid (Best answer)
Prompt 1 of 3: predict, then reveal.
What does the passive leg raise establish?
It establishes potential stroke-volume recruitment, not that another bolus is safe.
What additional evidence changes the fluid decision?
Worsening pulmonary edema and oxygenation indicate limited tolerance of further fluid.
What addresses the persistent vascular problem?
Norepinephrine is the first-line vasopressor for septic shock; ongoing reassessment should integrate perfusion, fluid response and congestion.
Treat the patient's pressure and perfusion problem while considering the harm of further filling.
Read the complete explanation
The flow response establishes potential stroke-volume recruitment, not that another bolus is safe. Worsening pulmonary edema and oxygenation indicate limited tolerance of further fluid. Norepinephrine is the first-line vasopressor for septic shock; ongoing reassessment should integrate perfusion, fluid response and congestion.
D. Substitute dobutamine alone because a positive fluid-response test establishes systolic pump failure (Why this does not fit)
Prompt 1 of 2: predict, then reveal.
When might an inotrope be relevant in septic shock?
It may be considered with cardiac dysfunction and persistent hypoperfusion despite adequate volume status and arterial pressure.
What does this case show instead?
Systolic function is preserved and pressure remains low. A positive PLR does not establish pump failure requiring dobutamine alone.
Preload responsiveness does not diagnose systolic dysfunction or replace vasopressor assessment.
Read the complete explanation
Dobutamine may be considered with cardiac dysfunction and persistent hypoperfusion despite adequate volume status and arterial pressure. Systolic function is preserved and pressure remains low. A positive PLR does not establish pump failure requiring dobutamine alone.
Takeaway: Treat the patient's pressure and perfusion problem while considering the harm of further filling.
A. SV 110 mL; stroke work cannot be calculated from volume boundaries alone (Best answer)
Prompt 1 of 2: predict, then reveal.
What volume does the second loop eject?
The second-loop stroke volume is 170 minus 60, or 110 mL.
Do the reported boundaries determine external stroke work?
External stroke work is the area enclosed by the pressure-volume loop. Volume boundaries specify its width but not its pressure path, so they do not determine that area.
Use volume width to find stroke volume and pressure-volume area to assess external work.
Read the complete explanation
The second-loop stroke volume is 170 minus 60, or 110 mL. External stroke work is the area enclosed by the pressure-volume loop. Volume boundaries specify its width but not its pressure path, so they do not determine that area.
B. SV 110 mL; stroke work can be calculated from volume boundaries alone (Why this does not fit)
Prompt 1 of 2: predict, then reveal.
What volume does the second loop eject?
The second-loop stroke volume of 110 mL is correct.
Do the reported boundaries determine external stroke work?
The work conclusion is not: the pressure-volume area requires pressure information as well as volume. Holding arterial load comparable does not supply the missing pressure path.
A correct ejected volume does not supply a missing pressure-volume work measurement.
Read the complete explanation
The second-loop stroke volume of 110 mL is correct. The work conclusion is not: the pressure-volume area requires pressure information as well as volume. Holding arterial load comparable does not supply the missing pressure path.
C. SV 90 mL; stroke work cannot be calculated from volume boundaries alone (Why this does not fit)
Prompt 1 of 2: predict, then reveal.
What volume does the second loop eject?
90 mL is the first-loop stroke volume, 150 minus 60. The second right boundary is 170 mL, so the current stroke volume is 110 mL.
Do the reported boundaries determine external stroke work?
The work limitation is correct: volume boundaries alone do not determine the pressure-volume area. A correct limitation cannot rescue the wrong stroke volume.
Use the current loop for volume while keeping the work-evidence limitation separate.
Read the complete explanation
90 mL is the first-loop stroke volume, 150 minus 60. The second right boundary is 170 mL, so the current stroke volume is 110 mL. The work limitation is correct: volume boundaries alone do not determine the pressure-volume area. A correct limitation cannot rescue the wrong stroke volume.
D. SV 90 mL; stroke work can be calculated from volume boundaries alone (Why this does not fit)
Prompt 1 of 2: predict, then reveal.
What volume does the second loop eject?
The second-loop width is 170 minus 60, or 110 mL, not the original 90 mL.
Do the reported boundaries determine external stroke work?
Stroke work is not loop width. Without pressure information, the reported boundaries do not determine the enclosed area, so the proposed work calculation is also unsupported.
Neither a baseline volume nor width alone determines current external stroke work.
Read the complete explanation
The second-loop width is 170 minus 60, or 110 mL, not the original 90 mL. Stroke work is not loop width. Without pressure information, the reported boundaries do not determine the enclosed area, so the proposed work calculation is also unsupported.
Takeaway: Use volume width to find stroke volume and pressure-volume area to assess external work.
A. Primary-prevention timing requirement has elapsed; QRS supports a resynchronization indication (Why this does not fit)
Prompt 1 of 2: predict, then reveal.
Has the applicable post-infarction recovery interval elapsed?
At 12 days after infarction and revascularization, the applicable primary-prevention waiting and reassessment period has not elapsed.
Does the measured QRS support ventricular resynchronization?
QRS 102 ms is narrow and does not supply the wide-QRS conduction pattern needed for the classic CRT indication.
Low EF cannot substitute for either timing or conduction eligibility.
Read the complete explanation
At 12 days after infarction and revascularization, the applicable primary-prevention waiting and reassessment period has not elapsed. QRS 102 ms is narrow and does not supply the wide-QRS conduction pattern needed for the classic CRT indication.
B. Primary-prevention timing requirement has not elapsed; QRS does not support a resynchronization indication (Best answer)
Prompt 1 of 2: predict, then reveal.
Has the applicable post-infarction recovery interval elapsed?
Twelve days is too early for the applicable primary-prevention recovery and reassessment period; no secondary-prevention event is described.
Does the measured QRS support ventricular resynchronization?
The QRS is 102 ms without a high-grade block or a stated pacing indication. The ECG does not support resynchronization merely because EF is low.
Assess primary-prevention timing separately from the ECG basis for resynchronization.
Read the complete explanation
Twelve days is too early for the applicable primary-prevention recovery and reassessment period; no secondary-prevention event is described. The QRS is 102 ms without a high-grade block or a stated pacing indication. The ECG does not support resynchronization merely because EF is low.
C. Primary-prevention timing requirement has elapsed; QRS does not support a resynchronization indication (Why this does not fit)
Prompt 1 of 2: predict, then reveal.
Has the applicable post-infarction recovery interval elapsed?
The timing claim is wrong: only 12 days have elapsed and treatment has just begun.
Does the measured QRS support ventricular resynchronization?
The QRS assessment is correct: a narrow 102 ms complex does not support the classic resynchronization indication.
An appropriate ECG conclusion does not shorten the recovery interval.
Read the complete explanation
The timing claim is wrong: only 12 days have elapsed and treatment has just begun. The QRS assessment is correct: a narrow 102 ms complex does not support the classic resynchronization indication.
D. Primary-prevention timing requirement has not elapsed; QRS supports a resynchronization indication (Why this does not fit)
Prompt 1 of 2: predict, then reveal.
Has the applicable post-infarction recovery interval elapsed?
The primary-prevention waiting period has correctly been identified as incomplete.
Does the measured QRS support ventricular resynchronization?
The independent QRS conclusion is wrong: 102 ms is not the prolonged activation pattern used for the classic CRT indication.
An incomplete waiting period does not make a narrow QRS a CRT indication.
Read the complete explanation
The primary-prevention waiting period has correctly been identified as incomplete. The independent QRS conclusion is wrong: 102 ms is not the prolonged activation pattern used for the classic CRT indication.
Takeaway: Assess primary-prevention timing separately from the ECG basis for resynchronization.
A. EDV 240 mL and ESV 120 mL (Why this does not fit)
Prompt 1 of 2: predict, then reveal.
Does this pair match the measured ejected volume?
Yes. It ejects 120 mL, the required 6,000/50 mL per cycle.
Does the ejected fraction also match?
No. The fraction is 120/240 = 50%, rather than the supplied 60%.
Matching output per cycle does not establish the correct ejected fraction.
Read the complete explanation
This pair ejects 240 - 120 = 120 mL, matching the measured output and rate. Its EF is 120/240 = 50%, not the supplied 60%; the required EDV is 200 mL and ESV is 80 mL.
B. EDV approximately 133 mL and ESV approximately 53 mL (Why this does not fit)
Prompt 1 of 2: predict, then reveal.
Which subject has stroke volume 80 mL?
The control does, because 6,000/75 equals 80 mL.
Why does that pair not fit the athlete?
At 50/min, the athlete must eject 120 mL per cycle to produce the same output.
Do not use the control's rate to calculate the athlete's volumes.
Read the complete explanation
The control has stroke volume 80 mL because 6,000/75 equals 80 mL. At 50/min, the athlete must eject 120 mL per cycle to produce the same output.
C. EDV 200 mL and ESV 80 mL (Best answer)
Prompt 1 of 3: predict, then reveal.
What stroke volume is required at 50/min?
6,000 divided by 50 equals 120 mL per cycle.
What EDV gives an EF of 60% with that stroke volume?
120 divided by 0.60 equals 200 mL.
What remains after ejection?
200 minus 120 equals 80 mL. The control has different volumes despite the same output and EF.
Equal output and EF can coexist with different chamber volumes when heart rates differ.
Read the complete explanation
6,000 divided by 50 equals 120 mL per cycle. 120 divided by 0.60 equals 200 mL. 200 minus 120 equals 80 mL. The control has different volumes despite the same output and EF.
D. EDV 200 mL and ESV 120 mL (Why this does not fit)
Prompt 1 of 2: predict, then reveal.
Why is EDV 200 mL plausible?
A 120 mL stroke volume is 60% of 200 mL.
Which number is the residual?
The remaining volume is 200 minus 120 = 80 mL; 120 mL is the amount ejected.
After finding EDV, subtract the ejected volume rather than relabeling it as residual.
Read the complete explanation
A 120 mL stroke volume is 60% of 200 mL. The remaining volume is 200 minus 120 = 80 mL; 120 mL is the amount ejected.
Takeaway: Equal output and EF can coexist with different chamber volumes when heart rates differ.
A. Output 6.6 L/min; EF approximately 61% (Why this does not fit)
Prompt 1 of 2: predict, then reveal.
What output follows from the new stroke volume and rate?
The output is correctly calculated: (190 - 115) x 88/1,000 = 6.6 L/min.
What fraction of the new EDV is ejected?
Approximately 61% is 115/190, the residual fraction. EF is 75/190, approximately 39%, and remains load dependent.
Separate total flow from the residual-volume fraction.
Read the complete explanation
The output is correctly calculated: (190 - 115) x 88/1,000 = 6.6 L/min. Approximately 61% is 115/190, the residual fraction. EF is 75/190, approximately 39%, and remains load dependent.
B. Output 5.28 L/min; EF approximately 39% (Why this does not fit)
Prompt 1 of 2: predict, then reveal.
What output follows from the new stroke volume and rate?
5.28 L/min combines the original SV of 60 mL with the new rate. The new SV is 75 mL, giving output 6.6 L/min.
What fraction of the new EDV is ejected?
The EF calculation is correct at 75/190, approximately 39%, but it does not rescue the mixed-time output calculation.
Do not combine the old stroke volume with the new rate.
Read the complete explanation
5.28 L/min combines the original SV of 60 mL with the new rate. The new SV is 75 mL, giving output 6.6 L/min. The EF calculation is correct at 75/190, approximately 39%, but it does not rescue the mixed-time output calculation.
C. Output 6.6 L/min; EF approximately 39% (Best answer)
Prompt 1 of 2: predict, then reveal.
What output follows from the new stroke volume and rate?
The new stroke volume is 75 mL; at 88/min, output is 6.6 L/min.
What fraction of the new EDV is ejected?
EF is 75/190, approximately 39%. Greater output with changed rate and loading does not by itself demonstrate recovery of injured myocardium.
Calculate minute flow and ejected fraction before interpreting compensation.
Read the complete explanation
The new stroke volume is 75 mL; at 88/min, output is 6.6 L/min. EF is 75/190, approximately 39%. Greater output with changed rate and loading does not by itself demonstrate recovery of injured myocardium.
D. Output 5.28 L/min; EF approximately 61% (Why this does not fit)
Prompt 1 of 2: predict, then reveal.
What output follows from the new stroke volume and rate?
Use the new EDV and ESV: SV 75 mL at 88/min gives 6.6 L/min, not 5.28 L/min.
What fraction of the new EDV is ejected?
Approximately 61% is the amount left as a fraction of EDV. The ejected fraction is approximately 39%.
Neither mixed-time output nor residual fraction proves myocardial recovery.
Read the complete explanation
Use the new EDV and ESV: SV 75 mL at 88/min gives 6.6 L/min, not 5.28 L/min. Approximately 61% is the amount left as a fraction of EDV. The ejected fraction is approximately 39%.
Takeaway: Calculate minute flow and ejected fraction before interpreting compensation.
A. One fifth of the control's compliance; EF 40% (Why this does not fit)
Prompt 1 of 2: predict, then reveal.
How much volume was gained per pressure increase?
Patient compliance is 10/10 = 1 mL/mm Hg versus 10/2 = 5 in the control, so the one-fifth comparison is correct.
What fraction was ejected during the subsequent contraction?
48/120 is the residual fraction, 40%. EF is (120 - 48)/120 = 60%.
A valid compliance comparison does not turn residual fraction into EF.
Read the complete explanation
Patient compliance is 10/10 = 1 mL/mm Hg versus 10/2 = 5 in the control, so the one-fifth comparison is correct. 48/120 is the residual fraction, 40%. EF is (120 - 48)/120 = 60%.
B. Five times the control's compliance; EF 60% (Why this does not fit)
Prompt 1 of 2: predict, then reveal.
How much volume was gained per pressure increase?
The patient has lower, not higher, compliance: the same 10 mL increment requires a larger pressure increase.
What fraction was ejected during the subsequent contraction?
The EF of 60% is correct, but preserved ejected fraction does not make passive filling compliance normal.
Preserved EF does not reverse a measured compliance impairment.
Read the complete explanation
The patient has lower, not higher, compliance: the same 10 mL increment requires a larger pressure increase. The EF of 60% is correct, but preserved ejected fraction does not make passive filling compliance normal.
C. One fifth of the control's compliance; EF 60% (Best answer)
Prompt 1 of 2: predict, then reveal.
How much volume was gained per pressure increase?
The patient's incremental compliance is 1 mL/mm Hg, one fifth of the control's 5 mL/mm Hg.
What fraction was ejected during the subsequent contraction?
SV is 120 - 48 = 72 mL and EF is 72/120 = 60%. Impaired passive filling can coexist with a preserved ejected fraction.
Measure passive filling cost separately from the ejected fraction.
Read the complete explanation
The patient's incremental compliance is 1 mL/mm Hg, one fifth of the control's 5 mL/mm Hg. SV is 120 - 48 = 72 mL and EF is 72/120 = 60%. Impaired passive filling can coexist with a preserved ejected fraction.
D. Five times the control's compliance; EF 40% (Why this does not fit)
Prompt 1 of 2: predict, then reveal.
How much volume was gained per pressure increase?
The compliance ratio is inverted: the patient has one fifth the control's compliance, not five times as much.
What fraction was ejected during the subsequent contraction?
40% is the residual fraction; the ejected fraction is 60%. Passive filling and systolic emptying require separate calculations.
Avoid inverting both compliance and ejected fraction.
Read the complete explanation
The compliance ratio is inverted: the patient has one fifth the control's compliance, not five times as much. 40% is the residual fraction; the ejected fraction is 60%. Passive filling and systolic emptying require separate calculations.
Takeaway: Measure passive filling cost separately from the ejected fraction.
A. EF 70%; correction of delayed ventricular activation (Why this does not fit)
Prompt 1 of 2: predict, then reveal.
What EF follows from the measured ventricular volumes?
126/180 is the residual fraction, 70%. The ejected fraction is (180 - 126)/180 = 30%.
Which conduction abnormality provides the relevant device target?
The wide LBBB pattern identifies delayed ventricular activation, but the incorrect EF would misrepresent the systolic eligibility assessment.
Interpret ventricular volumes before assigning a device-eligibility profile.
Read the complete explanation
126/180 is the residual fraction, 70%. The ejected fraction is (180 - 126)/180 = 30%. The wide LBBB pattern identifies delayed ventricular activation, but the incorrect EF would misrepresent the systolic eligibility assessment.
B. EF 30%; support of a minimum rate during sinus pauses (Why this does not fit)
Prompt 1 of 2: predict, then reveal.
What EF follows from the measured ventricular volumes?
EF is correctly calculated as 54/180 = 30%.
Which conduction abnormality provides the relevant device target?
The relevant finding is a wide LBBB with persistent symptoms despite therapy, not sinus pauses; resynchronization addresses the delayed activation.
A low EF alone does not identify the conduction problem being treated.
Read the complete explanation
EF is correctly calculated as 54/180 = 30%. The relevant finding is a wide LBBB with persistent symptoms despite therapy, not sinus pauses; resynchronization addresses the delayed activation.
C. EF 70%; support of a minimum rate during sinus pauses (Why this does not fit)
Prompt 1 of 2: predict, then reveal.
What EF follows from the measured ventricular volumes?
EF is 30%, not the 70% fraction remaining after contraction.
Which conduction abnormality provides the relevant device target?
Sinus pauses are absent. The prolonged LBBB pattern instead identifies delayed ventricular activation in a persistently symptomatic patient.
Neither a residual fraction nor an absent rhythm disorder supplies the target.
Read the complete explanation
EF is 30%, not the 70% fraction remaining after contraction. Sinus pauses are absent. The prolonged LBBB pattern instead identifies delayed ventricular activation in a persistently symptomatic patient.
D. EF 30%; correction of delayed ventricular activation (Best answer)
Prompt 1 of 2: predict, then reveal.
What EF follows from the measured ventricular volumes?
EDV minus ESV is 54 mL, giving EF 30%.
Which conduction abnormality provides the relevant device target?
Persistent symptoms, low EF, sinus rhythm and LBBB at 168 ms support CRT assessment, targeting delayed ventricular activation rather than an absent sinus-pause disorder.
Combine derived systolic function with the measured conduction pattern.
Read the complete explanation
EDV minus ESV is 54 mL, giving EF 30%. Persistent symptoms, low EF, sinus rhythm and LBBB at 168 ms support CRT assessment, targeting delayed ventricular activation rather than an absent sinus-pause disorder.
Takeaway: Combine derived systolic function with the measured conduction pattern.
A. Add dapagliflozin; defer starting spironolactone while addressing the elevated potassium (Best answer)
Prompt 1 of 2: predict, then reveal.
Which proposed addition matches the missing treatment and resting rate?
Dapagliflozin supplies an unprescribed disease-modifying class for symptomatic HFrEF, including patients without diabetes; a sinus rate of 62/min does not meet the usual ivabradine rate criterion.
Do the current potassium and kidney findings permit MRA initiation?
Potassium 5.4 mmol/L is above the initiation threshold for an MRA. Address it and reassess rather than initiating spironolactone at this value.
Match the additional class and independently check MRA laboratory eligibility.
Read the complete explanation
Dapagliflozin supplies an unprescribed disease-modifying class for symptomatic HFrEF, including patients without diabetes; a sinus rate of 62/min does not meet the usual ivabradine rate criterion. Potassium 5.4 mmol/L is above the initiation threshold for an MRA. Address it and reassess rather than initiating spironolactone at this value.
B. Add dapagliflozin; start spironolactone now with the current potassium (Why this does not fit)
Prompt 1 of 2: predict, then reveal.
Which proposed addition matches the missing treatment and resting rate?
Dapagliflozin is the appropriate proposed addition given symptomatic HFrEF and the unprescribed SGLT2 class, independent of diabetes status.
Do the current potassium and kidney findings permit MRA initiation?
The spironolactone plan is wrong: acceptable GFR does not override potassium 5.4 mmol/L, which argues against initiation now.
A suitable new drug does not make a different drug safe to start.
Read the complete explanation
Dapagliflozin is the appropriate proposed addition given symptomatic HFrEF and the unprescribed SGLT2 class, independent of diabetes status. The spironolactone plan is wrong: acceptable GFR does not override potassium 5.4 mmol/L, which argues against initiation now.
C. Add ivabradine; defer starting spironolactone while addressing the elevated potassium (Why this does not fit)
Prompt 1 of 2: predict, then reveal.
Which proposed addition matches the missing treatment and resting rate?
The MRA caution is appropriate, but ivabradine is not the proposed class to add at a resting sinus rate of 62/min.
Do the current potassium and kidney findings permit MRA initiation?
The elevated potassium warrants addressing the cause and reassessing MRA eligibility rather than starting spironolactone immediately.
A correct potassium precaution does not justify an unsuitable rate-lowering choice.
Read the complete explanation
The MRA caution is appropriate, but ivabradine is not the proposed class to add at a resting sinus rate of 62/min. The elevated potassium warrants addressing the cause and reassessing MRA eligibility rather than starting spironolactone immediately.
D. Add ivabradine; start spironolactone now with the current potassium (Why this does not fit)
Prompt 1 of 2: predict, then reveal.
Which proposed addition matches the missing treatment and resting rate?
Ivabradine does not fit the resting rate of 62/min and does not replace the missing SGLT2 inhibitor class.
Do the current potassium and kidney findings permit MRA initiation?
Starting spironolactone with potassium 5.4 mmol/L is not supported; the potassium threshold matters independently of the acceptable GFR.
Both the medication choice and the laboratory-dependent plan must fit.
Read the complete explanation
Ivabradine does not fit the resting rate of 62/min and does not replace the missing SGLT2 inhibitor class. Starting spironolactone with potassium 5.4 mmol/L is not supported; the potassium threshold matters independently of the acceptable GFR.
Takeaway: Match the additional class and independently check MRA laboratory eligibility.