Follow air, blood and pressure through working lung models, then solve clinical cases that distinguish ventilation, gas transfer and oxygen carriage.
Why can twice as many breaths remove less carbon dioxide? Start with the air that actually reaches exchange surfaces, then connect that result to blood flow and pressure.
Same air per minute. Different useful ventilation.
Two people each breathe 6 liters every minute. One takes 12 breaths of 500 mL; the other takes 24 breaths of 250 mL. Will both remove the same amount of carbon dioxide? First separate the air that reaches exchange surfaces from the air that stays in conducting passages.
Tidal volume is the volume of one breath. Dead space is ventilated volume that does not exchange gas with pulmonary blood. Anatomical dead space is conducting airway volume; alveolar dead space is ventilated alveolar volume without effective perfusion. The total is physiological dead space. A collapsed but perfused alveolus is a shunt-like unit, not dead space.
Where does each breath go?
Predict whether smaller, faster breaths keep useful ventilation unchanged. This model fixes dead space at 150 mL per breath.
Dead-space air: 150 mL
Exchange volume: 350 mL
4.2 L/min useful ventilation
(500 − 150) × 12 = 4200 mL/min. Total minute ventilation is 6 L/min.
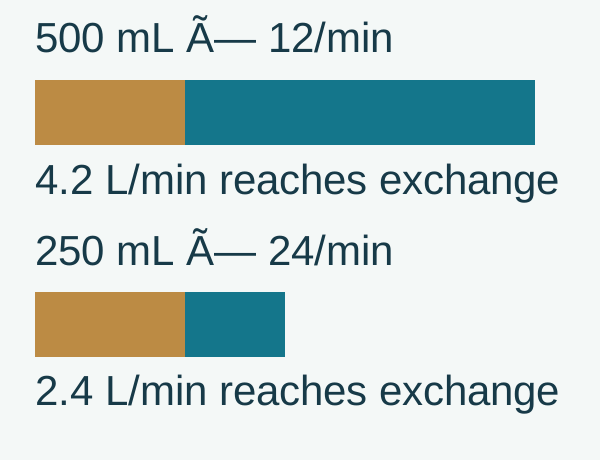
Worked comparison: 500 mL × 12 gives 4.2 L/min useful ventilation; 250 mL × 24 gives 2.4 L/min; 750 mL × 8 gives 4.8 L/min. All move 6 L/min total air. The per-breath bar is scaled to 750 mL. At the stated breath size and rate, dead space changes useful alveolar ventilation.
Enlarge whole imageGold is dead-space volume; teal is exchange volume. Both breathing patterns move 6 L/min, but repeated filling of the same dead space leaves different useful ventilation.Bone Wizardry · Original explanatory schematic.
Minute ventilation = tidal volume × respiratory rate.Alveolar ventilation = (tidal volume − dead-space volume) × respiratory rate. In the model, dead space is deliberately fixed at 150 mL per breath. That is a teaching assumption, not a universal patient value. Divide mL/min by 1000 to obtain L/min.
At steady carbon dioxide production, arterial carbon dioxide pressure varies inversely with alveolar ventilation. Halving useful ventilation approximately doubles PaCO2, the carbon dioxide pressure measured in arterial blood. Respiratory rate alone cannot tell you whether ventilation is adequate.
Central chemoreceptors respond largely to the change in cerebrospinal fluid acidity produced when carbon dioxide crosses into the brain. Peripheral chemoreceptors also sense arterial oxygen and acidity. These feedback systems change the breathing pattern; they do not remove dead space.
What volume in each 500 mL breath reaches exchange surfaces in this model?
500 − 150 = 350 mL.
How much useful ventilation does 12 of those breaths provide?
350 × 12 = 4200 mL/min, or 4.2 L/min.
What remains of each breath when tidal volume falls to 250 mL?
250 − 150 = 100 mL reaches exchange surfaces.
Does doubling the rate restore the original useful ventilation?
No. 100 × 24 = 2.4 L/min, despite the same 6 L/min total.
Use it in a new situation
A connector adds 50 mL of dead space while breath size and rate stay fixed. What changes first?
Check your reasoning
Useful ventilation falls by 50 mL per breath. If carbon dioxide production is unchanged and no compensation occurs, PaCO2 rises.
An exchange unit needs both air and blood.
Ventilation supplies fresh alveolar gas. Perfusion supplies blood that can carry exchanged gas away. The ventilation/perfusion ratio, V/Q, compares those flows. An overall value around 0.8 reflects roughly 4 L/min alveolar ventilation and 5 L/min blood flow; an individual unit need not have that ratio.
A low V/Q unit receives too little fresh air for its blood flow. A true shunt is the limiting case: blood passes through without reaching ventilated exchange surfaces. A dead-space unit has the opposite failure: air reaches the unit, but blood does not. Raising inspired oxygen cannot make a completely unperfused unit export oxygen to blood.
Interrupt air or interrupt blood
Which interruption leaves blood flowing past gas it cannot use? Predict, then alter one flow. Compare the blood and air routes separately.
Both flows are present.
Ventilation renews gas; perfusion brings blood that can carry oxygen away.
Worked comparison: Less air with unchanged blood produces low V/Q. No air with persisting blood is shunt-like. No blood with air still entering is alveolar dead space, with no oxygenated blood output. Dots indicate relative gas availability, not measured PaO2 or particle counts. Other perfused lung regions are not shown.
The rest of the lung matters. In pulmonary embolism, dead space develops in obstructed vascular territories, while blood redistribution and other changes can produce low V/Q elsewhere. A better arterial oxygen value after supplemental oxygen does not prove a single diagnosis. A substantial true intrapulmonary shunt responds less well to oxygen than ordinary low V/Q mismatch; oxygen is still used when clinically indicated.
In an upright lung, ventilation and perfusion both increase toward the base, but perfusion increases more. The apex therefore has relatively higher V/Q and the base relatively lower V/Q. Hypoxic pulmonary vasoconstriction narrows small pulmonary vessels near poorly ventilated alveoli, tending to redirect blood toward better ventilation.
West zones describe pressure relationships, not permanent labels painted on the lung. Zone 1 has alveolar pressure above arterial and venous pressure; zone 2 has arterial above alveolar above venous; zone 3 has both vascular pressures above alveolar pressure. Low vascular pressure or excessive alveolar pressure can create zone 1 conditions. Do not assume every normal apex is zone 1.
In a simplified two-compartment model, arterial oxygen content is the blood-flow-weighted average of blood leaving each compartment. If 20% of flow leaves at 12 mL/dL and 80% leaves at 20 mL/dL, the mixture contains 0.2 × 12 + 0.8 × 20 = 18.4 mL/dL. Mix oxygen content, not oxygen pressure: the hemoglobin dissociation curve makes pressure relationships nonlinear.
If air entry falls while blood flow stays fixed, which side of V/Q becomes smaller?
The numerator, ventilation, falls.
If air entry reaches zero but blood still exits, what does that blood miss?
It misses contact with freshly ventilated gas: a shunt-like unit.
If blood flow instead reaches zero, can extra inspired oxygen supply that missing flow?
No. Oxygen-rich gas has no perfused blood leaving that unit to carry it away.
Use it in a new situation
A ventilated region loses its blood supply. Does its exhaled gas approach mixed venous gas or inspired gas?
Check your reasoning
Inspired gas. With no incoming blood to remove oxygen or deliver carbon dioxide, the gas becomes relatively oxygen-rich and carbon-dioxide-poor.
Find where oxygen was lost.
PAO2 means alveolar oxygen pressure; PaO2 means arterial oxygen pressure. The capital A refers to the alveolus, not a different unit. The A-a difference asks how much pressure was lost between alveolar gas and arterial blood.
For the examples here, the simplified alveolar gas equation is PAO2 = FiO2 × (PB − 47) − PaCO2 / R. FiO2 is the inspired oxygen fraction, PB the barometric pressure in mmHg, 47 mmHg the water-vapor pressure at body temperature, and R the respiratory exchange ratio. We specify R = 0.8. This simplified form is most useful near room air; do not treat it as an exact high-FiO2 equation.
Follow the oxygen-pressure drop
All examples use room air, water-vapor pressure 47 mmHg and R = 0.8. Which change begins before gas transfer?
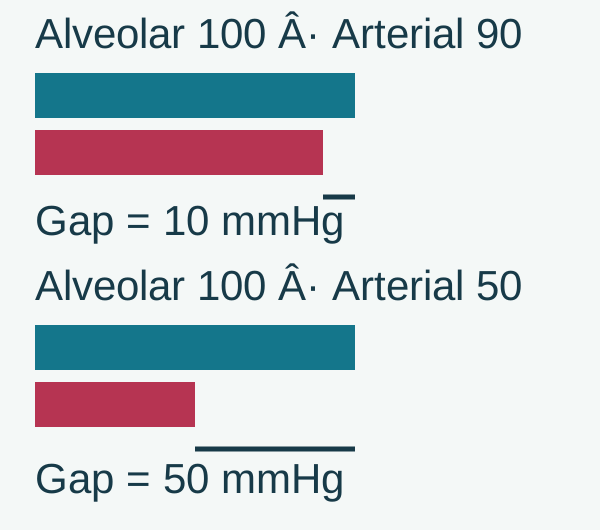
Worked comparison: Hypoventilation: PB 760, PaCO2 64, PaO2 63 gives PAO2 69.7 and a gap of 6.7. Altitude: PB 500, PaCO2 28, PaO2 57 gives PAO2 60.1 and gap 3.1. Transfer example: PB 760, PaCO2 40, PaO2 50 gives PAO2 99.7 and gap 49.7 mmHg. Bars share a 160 mmHg scale. Compare the calculated gradients at the stated pressures.
Enlarge whole imageTeal bars show alveolar oxygen and red bars show arterial oxygen on the same scale. A larger A-a gap requires interpretation beyond inspired oxygen pressure or pure hypoventilation.Bone Wizardry · Original explanatory schematic.
At sea level on room air, FiO2 = 0.21 and PB = 760. With PaCO2 = 40, PAO2 is about 100 mmHg: 0.21 × 713 − 40/0.8. If PaO2 is 60, the A-a difference is about 40. Interpret that difference using age, inspired oxygen and the clinical setting, not one threshold for every patient.
Hypoventilation and reduced inspired oxygen pressure can lower PAO2 and PaO2 together while leaving the A-a difference near its expected range. V/Q mismatch, shunt and diffusion impairment can widen it. A calculation supports a mechanism; it does not exclude coexisting disease.
Diffusion improves with a larger exchange area and a larger pressure difference, and worsens with a thicker barrier. Fibrosis thickens the barrier; emphysema destroys exchange surface. During exercise, shorter capillary transit time can expose a diffusion limitation that was less apparent at rest.
DLCO is a test of carbon monoxide transfer from alveolar gas into blood. It depends on the membrane, available pulmonary capillary blood and hemoglobin, so anemia can lower it without destroying alveoli. Interpret a hemoglobin-adjusted result alongside lung volumes and the rest of the assessment.
Water vapor occupies part of the inspired gas pressure after humidification.
Why does rising PaCO2 lower calculated PAO2 at fixed inspired oxygen?
The equation subtracts the carbon dioxide term from available inspired oxygen pressure.
If both alveolar and arterial oxygen fall together, must the transfer gap become large?
No. Low oxygen can begin before the alveolar-to-blood transfer step.
Use it in a new situation
A young adult on room air has PaCO2 60 and PaO2 70 mmHg at sea level. With R = 0.8, where is the main problem?
Check your reasoning
PAO2 is approximately 150 − 75 = 75 mmHg, giving an A-a difference near 5. This supports hypoventilation rather than a large transfer defect.
Pressure drives flow; stiffness and narrowing resist it.
Compliance is change in volume divided by change in distending pressure. A stiff lung accepts less volume for the same pressure change. A highly compliant lung expands easily but may have poor elastic recoil, making expiration difficult. Ease of inflation and ease of emptying are not the same property.
Air enters when alveolar pressure is below atmospheric pressure and leaves when it is above. During ordinary quiet breathing, pleural pressure usually remains negative relative to atmosphere. During forced expiration it can become positive, compressing intrathoracic airways. Transpulmonary pressure = alveolar pressure − pleural pressure; it is the pressure distending the lung.
Which pressure changes?
400 mL breaths. PEEP 5 cmH2O. Flow stays fixed; no intrinsic PEEP. Predict what narrowing or stiffness changes.
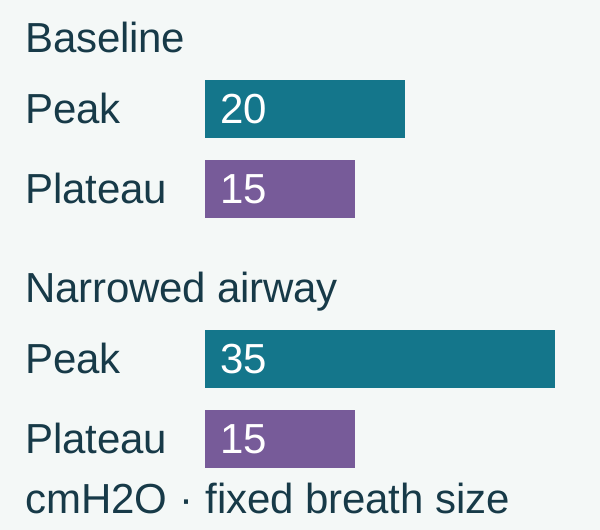
Worked comparison: Increased resistance raises peak to 35 while plateau stays 15. Reduced compliance raises peak to 30 and plateau to 25; the resistive difference stays 5, while compliance falls to 20 mL/cmH2O. Bar heights share a 40 cmH2O scale. This is a fixed-condition comparison, not an automatic ventilator-adjustment tool.
Enlarge whole imageWith flow and breath size fixed, rising peak pressure without rising plateau increases the resistive pressure difference. All pressures are cmH2O.Bone Wizardry · Original explanatory schematic.
During a passive ventilator breath with unchanged flow and settings, the pressure difference between peak and plateau pressure reflects resistive pressure. Plateau pressure is measured during an inspiratory hold with no airflow. If both peak and plateau rise while their difference stays similar, reduced respiratory-system compliance is more likely than isolated increased airway resistance.
FEV1 is forced expired volume in the first second; FVC is the total volume forcibly exhaled after a maximal inspiration. A low FEV1/FVC relative to the appropriate lower limit of normal supports obstruction. Air trapping can lower FVC too, so a low FVC alone does not establish restriction.
Total lung capacity (TLC) is all air present after maximal inspiration. Restriction requires a reduced TLC. Residual volume (RV) is air left after maximal expiration. Ordinary spirometry cannot directly measure RV or capacities containing it. Obstruction with low FVC but normal or high TLC may reflect trapped gas rather than a second restrictive disorder.
A scooped expiratory flow-volume limb supports expiratory flow limitation. Variable extrathoracic obstruction preferentially flattens inspiration; variable intrathoracic obstruction preferentially flattens expiration; fixed central obstruction can flatten both. Loops require acceptable technique and clinical correlation. A reversible response does not, by itself, establish a specific diagnosis.
Airway plateau pressure reflects both lung and chest-wall mechanics. To isolate the lung, compare changes in transpulmonary pressure: the change in alveolar pressure minus the change in pleural pressure. At no flow, airway pressure estimates alveolar pressure. Two systems can therefore have the same airway driving pressure but different lung compliance if their pleural pressure changes differ. Actual pleural-pressure estimates require careful measurement.
During forced expiration, pressure falls along the airway toward the mouth. At the equal-pressure point, pressure inside equals surrounding pleural pressure. Farther toward the mouth, lower internal pressure can compress a compliant airway. In the simplified model, reduced elastic recoil leaves a smaller alveolar-to-pleural pressure margin, so equality can occur closer to the smaller peripheral airways. This model isolates pressure relationships; actual flow also depends on airway geometry and tissue properties.
What happens to volume gain if the same pressure is applied to a stiffer lung?
The volume gain becomes smaller.
At a no-flow inspiratory hold, does airway resistance still create a flow-related pressure drop?
No. With flow stopped, the resistive component is removed from the measurement.
Can a reduced FVC distinguish a small lung from air that cannot be expelled?
No. TLC is needed to distinguish restriction from air trapping.
Use it in a new situation
Peak pressure rises from 25 to 40 cmH2O while plateau remains 20. Flow, tidal volume and PEEP are unchanged. What changed?
Check your reasoning
The resistive pressure difference rose from 5 to 20 cmH2O. Consider increased airway or tube resistance rather than isolated loss of compliance.
Normal oxygen pressure does not guarantee normal oxygen content.
Most oxygen is carried on hemoglobin; only a small amount is dissolved in plasma. PaO2 describes dissolved-gas pressure, not the number of available hemoglobin binding sites. Two samples can have the same PaO2 and saturation but different total oxygen content if their hemoglobin concentrations differ.
A useful approximation is arterial oxygen content = 1.34 × hemoglobin × saturation + 0.003 × PaO2, in mL O2/dL when hemoglobin is g/dL and saturation is a fraction. The coefficient 1.34 estimates hemoglobin-bound oxygen capacity; 0.003 estimates dissolved oxygen solubility. Oxygen delivery also depends on cardiac output.
Same oxygen pressure. Fewer binding sites.
Both examples have PaO2 100 mmHg and saturation 98%. Predict the effect of halving hemoglobin without changing either reading.
Hemoglobin-bound oxygen19.7 mL/dL
Dissolved oxygen0.3 mL/dL in both samples
Total oxygen content: 20.0 mL/dL.
1.34 × 15 × 0.98 + 0.003 × 100 = 20.0 mL O2/dL.
Worked comparison: At 7.5 g/dL hemoglobin, bound oxygen is about 9.85 mL/dL and total content about 10.1 mL/dL. Pressure and saturation stay unchanged. Bar lengths share a 21 mL/dL scale.
A right-shifted hemoglobin dissociation curve means lower oxygen affinity and easier unloading at a given oxygen pressure. Higher temperature, greater acidity and higher 2,3-BPG can shift the curve right. The Bohr effect describes how carbon dioxide and acidity facilitate oxygen unloading in tissues.
The Haldane effect describes a different relationship: deoxygenated hemoglobin carries more carbon dioxide and buffers more hydrogen ions than oxygenated hemoglobin. Oxygenation in the lungs favors carbon dioxide release. This is not the same mechanism as changing pulmonary vessel caliber.
In severe obstructive lung disease with acute respiratory failure, carbon dioxide can rise after high-concentration oxygen even when minute ventilation nearly returns to its prior value. This observation argues against explaining every case as loss of a single hypoxic drive. Changes in V/Q matching and oxygen-linked carbon dioxide carriage can contribute. Hypoxemia still requires appropriately titrated oxygen and clinical monitoring.
Oxygen delivery depends on cardiac output multiplied by arterial oxygen content. At steady state, oxygen consumption is cardiac output multiplied by the arterial-minus-mixed-venous oxygen content difference. A mixed venous sample reflects blood returning from the whole body. Interpret a lower mixed venous saturation with both flow and incoming arterial content; it does not by itself distinguish lower delivery from greater tissue oxygen use.
If hemoglobin falls by half, what happens to its oxygen-carrying capacity?
The hemoglobin-bound component is approximately halved.
Does a normal dissolved oxygen pressure restore the missing binding sites?
No. PaO2 cannot replace the hemoglobin that is absent.
Why does oxygenating blood help unload carbon dioxide in the lungs?
Oxygenated hemoglobin holds less carbon dioxide and buffers less hydrogen ion.
Use it in a new situation
After an acute fall in hemoglobin, PaO2 and arterial saturation are unchanged. Can oxygen delivery still fall?
Check your reasoning
Yes. Oxygen content falls with hemoglobin, and delivery can fall unless increased cardiac output compensates.
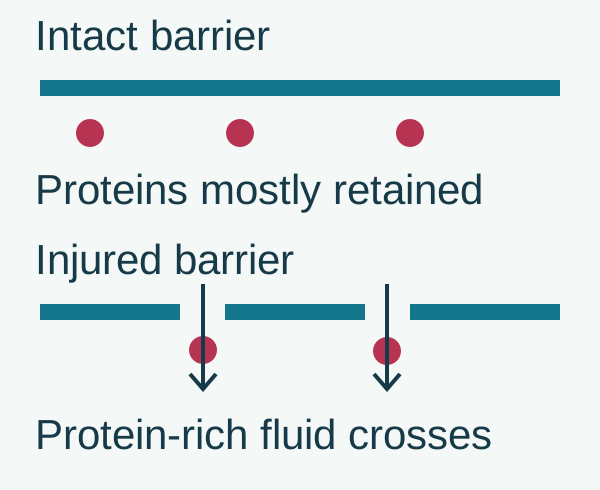
An injured barrier changes both fluid movement and mechanics.
Thin type I alveolar epithelial cells cover most of the gas-exchange surface. Type II cells produce surfactant and contribute to epithelial repair. Alveolar macrophages are immune cells that clear material and participate in inflammatory responses. These are different jobs, not interchangeable cell labels.
Surfactant lowers surface tension at the air-liquid interface and helps stabilize alveoli. In the simplified spherical model, collapsing pressure is proportional to 2 × surface tension / radius. At equal surface tension, a smaller radius gives greater collapsing pressure. Real alveoli share walls and are more complex than isolated soap bubbles.
Enlarge whole imageInflammatory barrier injury permits protein-rich fluid to enter airspaces. Hydrostatic edema begins with increased pressure across the barrier.Bone Wizardry · Original explanatory schematic.
In acute respiratory distress syndrome (ARDS), inflammatory injury increases alveolar-capillary permeability. Protein-rich fluid enters airspaces; epithelial injury and surfactant dysfunction further reduce aeration. The result can include low compliance and shunt-like perfusion of poorly ventilated regions. Type II cell injury alone is not a complete explanation.
Diffuse bilateral opacities and hypoxemia must be interpreted with timing, risk factors and assessment of competing causes, including hydrostatic edema. For an intubated patient, the PaO2/FiO2 ratio uses FiO2 as a fraction: a PaO2 of 80 on FiO2 0.50 gives 160, not 1.6. A ratio alone is not the entire diagnosis.
Lung-protective ventilation limits tidal volume, generally 4 to 8 mL/kg predicted body weight, and plateau pressure below 30 cmH2O. A common starting tidal volume is 6 mL/kg predicted weight. Predicted weight reflects height and sex, not actual weight gain. Severe ARDS can benefit from prolonged prone positioning; management requires the full clinical context.
Which cell makes the material that lowers surface tension?
The type II alveolar epithelial cell.
If surface tension rises at the same radius, what happens to collapsing pressure?
It rises, making small airspaces harder to keep open.
If blood continues through a fluid-filled, unventilated unit, what gas-exchange pattern develops?
A shunt-like pattern: perfusion persists without effective ventilation.
Use it in a new situation
A patient weighs 120 kg but has a predicted body weight of 60 kg. What tidal volume corresponds to 6 mL/kg predicted weight?
Check your reasoning
360 mL. Using actual weight would produce 720 mL and needlessly increase the proposed breath size.
Use exposure, distribution and a specific discriminator together.
An occupation is a starting point, not a diagnosis. Identify the inhaled material, intensity and duration, latency, imaging pattern and competing explanations. Scarred parenchyma, pleural exposure markers and an airway reaction are different consequences of inhaled exposures.
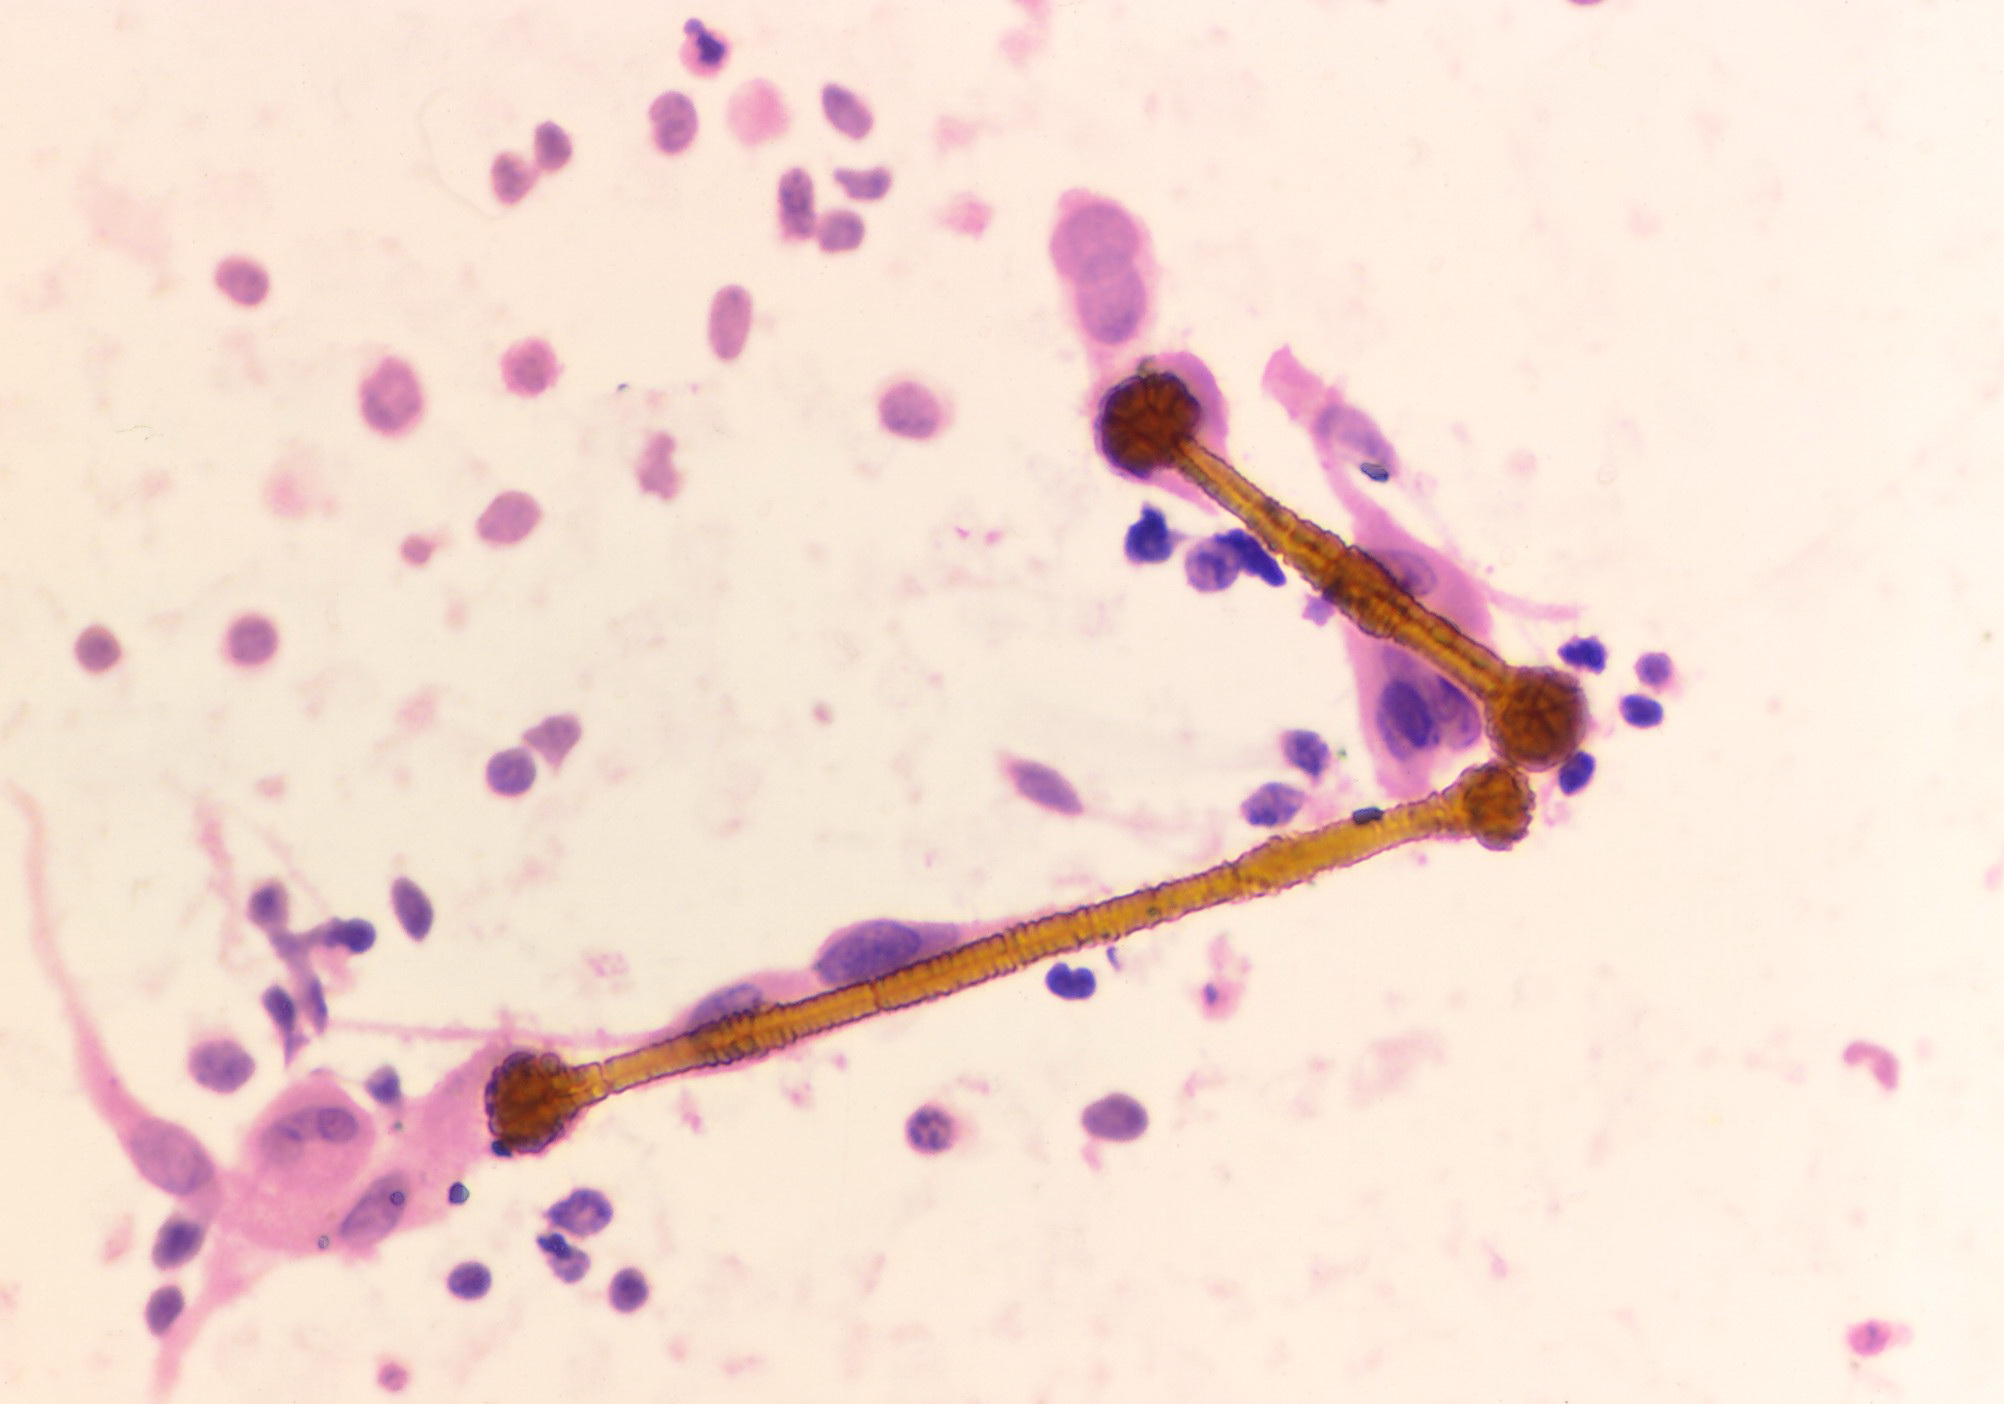
Asbestos: parenchymal asbestosis often has a basal and peripheral fibrotic pattern. Pleural plaques are evidence of exposure but do not, by themselves, establish parenchymal asbestosis. An asbestos body is a coated fiber, not an entire macrophage. Asbestos exposure increases lung cancer and mesothelioma risk; smoking amplifies asbestos-related lung cancer risk, not mesothelioma in the same way.
Enlarge whole imageFind ferruginous bodies in the bronchial washing and compare their coated fibers with the adjacent cells. Use the exposure history and lung assessment to evaluate disease extent. Image: Yale Rosen; source; CC BY-SA 2.0.
Silica: cutting engineered stone, sandblasting and related work can cause silicosis, often with upper-lung nodules. Calcified hilar nodes can occur, but an eggshell pattern is not unique to silica exposure. Silica-exposed workers and people with silicosis have increased tuberculosis risk. Fever, weight loss or new cavitation needs assessment rather than attribution to old scars.
Coal and beryllium: coal dust can produce nodular pneumoconiosis and progressive massive fibrosis; rheumatoid disease with pneumoconiosis can produce Caplan syndrome. Beryllium exposure may produce noncaseating granulomatous lung disease resembling sarcoidosis. A beryllium lymphocyte proliferation test (BeLPT), interpreted with the clinical and tissue assessment, helps establish sensitization. Exposure history alone is not the only discriminator.
Organic dust: cotton, flax or hemp exposure can produce byssinosis, an airway illness with work-related chest tightness, sometimes most noticeable after returning from time away. Do not automatically classify it as the same restrictive mineral-dust fibrosis as silicosis or asbestosis.
Study the whole clinical image and compare the coated fibers with the surrounding cells. Explanatory schematics are separate from the photograph; no unverified labels are drawn over a clinical image.
A positive IGRA, an interferon-gamma release assay, shows immune sensitization to tuberculosis infection but does not distinguish active from latent infection. New symptoms or a cavity require evaluation for active disease even after a negative sputum smear, including respiratory nucleic-acid testing and culture as appropriate. Likewise, confirmed beryllium sensitization without evidence of lung disease is not identical to sensitization with granulomatous lung inflammation.
Why can noncaseating granulomas leave beryllium disease and sarcoidosis in the differential?
Both can produce that tissue pattern.
What exposure-specific immune test helps separate the two?
BeLPT assesses a lymphocyte response to beryllium, with confirmatory interpretation in context.
Use it in a new situation
A silica-exposed worker with stable nodules develops fever and an upper-lung cavity. Is old pneumoconiosis a sufficient explanation?
Check your reasoning
No. The new systemic symptoms and cavity require evaluation for an additional process, including tuberculosis.
Clinical transfer cases
Work from the complete findings before opening the choices. Combine mechanisms, calculations and competing explanations. All cases and explanations remain available without JavaScript.
Saving is optional and browser-local. It does not certify mastery or sync a study position to your account.
Case 1
Show answer and explanations for case 1
A. 53 mmHg (Why this does not fit)
Predict, then explain
What change would produce a modest rise to 53?
A smaller fall in useful ventilation could produce that value.
What is the actual ratio to apply?
Initial divided by final alveolar ventilation is 4.2/2.4, or 1.75.
Read the complete explanation
A smaller fall in useful ventilation could produce that value. Initial divided by final alveolar ventilation is 4.2/2.4, or 1.75.
B. 23 mmHg (Why this does not fit)
Predict, then explain
What does 23 mmHg imply about useful ventilation?
It implies increased alveolar ventilation.
Does the faster pattern actually increase useful ventilation?
No. Smaller breaths devote more of each breath to the fixed dead space.
Read the complete explanation
It implies increased alveolar ventilation. No. Smaller breaths devote more of each breath to the fixed dead space.
C. 80 mmHg (Why this does not fit)
Predict, then explain
Why is 80 an attractive shortcut?
Halving tidal volume looks like halving useful ventilation.
What prevents that shortcut here?
Respiratory rate also doubles; the actual useful-ventilation ratio is 1.75, not 2.
Read the complete explanation
Halving tidal volume looks like halving useful ventilation. Respiratory rate also doubles; the actual useful-ventilation ratio is 1.75, not 2.
D. 70 mmHg (Best answer)
Predict, then explain
How much useful ventilation was present initially?
(500 − 150) × 12 = 4200 mL/min.
How much remains after the change?
(250 − 150) × 24 = 2400 mL/min.
What follows from the inverse carbon dioxide relationship?
The deficit is one quarter of the full venous-to-end-capillary difference.
Why can content not stay at 18?
The poorly oxygenated fraction doubles while both source contents stay fixed.
Read the complete explanation
The deficit is one quarter of the full venous-to-end-capillary difference. The poorly oxygenated fraction doubles while both source contents stay fixed.
B. 50%; then 12 mL/dL (Why this does not fit)
Predict, then explain
What initial content would 50% shunting produce?
16 mL/dL, not the measured 18.
When does the model reach 50%?
After doubling the initial 25%, not before.
Read the complete explanation
16 mL/dL, not the measured 18. After doubling the initial 25%, not before.
C. 25%; then 16 mL/dL (Best answer)
Predict, then explain
What fraction of the full oxygen-content deficit is present initially?
No. It reverses the given alveolar-to-vascular ordering.
Read the complete explanation
Vascular pressures above alveolar pressure favor perfusion. No. It reverses the given alveolar-to-vascular ordering.
B. Capillary compression with increased alveolar dead space (Best answer)
Predict, then explain
Which pressure is highest in this region?
Alveolar pressure exceeds both vascular pressures.
What can that external pressure do to thin-walled vessels?
Compress them and limit local perfusion.
What happens when ventilation persists but perfusion falls?
Alveolar dead space increases.
Read the complete explanation
Alveolar pressure exceeds both vascular pressures. Compress them and limit local perfusion. Alveolar dead space increases.
C. Preserved perfusion with newly absent ventilation (Why this does not fit)
Predict, then explain
Which defect would preserved blood with no air create?
A shunt-like unit.
Does this ordering primarily remove air entry or vascular flow?
It primarily limits local vascular flow in this ventilated region.
Read the complete explanation
A shunt-like unit. It primarily limits local vascular flow in this ventilated region.
D. Greater capillary recruitment with decreased alveolar dead space (Why this does not fit)
Predict, then explain
What favors capillary recruitment instead?
Adequate vascular pressure relative to surrounding alveolar pressure.
What ordering was measured here?
Surrounding alveolar pressure is higher, favoring compression rather than recruitment.
Read the complete explanation
Adequate vascular pressure relative to surrounding alveolar pressure. Surrounding alveolar pressure is higher, favoring compression rather than recruitment.
E. Increased hydrostatic filtration from pulmonary venous hypertension (Why this does not fit)
Predict, then explain
What pressure is central to hydrostatic edema?
Increased pulmonary venous or capillary hydrostatic pressure.
Is venous pressure the dominant high pressure here?
No. Alveolar pressure exceeds the vascular pressures.
Read the complete explanation
Increased pulmonary venous or capillary hydrostatic pressure. No. Alveolar pressure exceeds the vascular pressures.
Takeaway: High surrounding alveolar pressure can turn a ventilated region into an underperfused region.
A. A larger exchange surface that slows oxygen equilibration (Why this does not fit)
Predict, then explain
How does greater surface area affect diffusion?
It increases transfer capacity, other factors held constant.
Would it explain worsening equilibration?
No. Lost area or a thicker barrier is the relevant direction of change.
Read the complete explanation
It increases transfer capacity, other factors held constant. No. Lost area or a thicker barrier is the relevant direction of change.
B. Increased resting alveolar ventilation that creates a true shunt (Why this does not fit)
Predict, then explain
Does increased ventilation remove air from perfused alveoli?
No. It supplies more gas.
What does a true intrapulmonary shunt require?
Perfusion without effective ventilation in the affected region.
Read the complete explanation
No. It supplies more gas. Perfusion without effective ventilation in the affected region.
C. An isolated reduction in hemoglobin concentration with normal membrane transfer (Why this does not fit)
Predict, then explain
Why can anemia lower an unadjusted DLCO?
Less hemoglobin is available to bind the test gas.
What weakens anemia as the explanation here?
DLCO is hemoglobin-adjusted, and reduced TLC indicates an additional restrictive pattern.
Read the complete explanation
Less hemoglobin is available to bind the test gas. DLCO is hemoglobin-adjusted, and reduced TLC indicates an additional restrictive pattern.
D. A thickened exchange barrier with shortened exercise capillary transit time (Best answer)
Predict, then explain
What do reduced TLC and reduced adjusted DLCO suggest together?
A restrictive parenchymal process with impaired gas transfer.
What changes when blood traverses capillaries faster during exercise?
There is less time for equilibration.
Why can oxygen fall despite greater air movement?
A diseased barrier may not transfer oxygen rapidly enough during the shortened transit.
Read the complete explanation
A restrictive parenchymal process with impaired gas transfer. There is less time for equilibration. A diseased barrier may not transfer oxygen rapidly enough during the shortened transit.
E. A reduction in conducting airway dead space during exercise (Why this does not fit)
Predict, then explain
What would reduced conducting dead space tend to do?
Increase useful ventilation for the same breathing pattern.
Does that explain a low adjusted DLCO and exercise oxygen fall?
No. It improves ventilation rather than identifying the transfer limitation.
Read the complete explanation
Increase useful ventilation for the same breathing pattern. No. It improves ventilation rather than identifying the transfer limitation.
Takeaway: A diseased diffusion barrier can become more limiting when exercise shortens capillary transit time.
A. Loss of alveolar walls with reduced recoil and enlarged TLC (Why this does not fit)
Predict, then explain
What happens to recoil and TLC in typical emphysema?
Recoil falls and TLC is often increased.
Which findings point in the opposite direction?
TLC is reduced and adjusted DLCO is preserved.
Read the complete explanation
Recoil falls and TLC is often increased. TLC is reduced and adjusted DLCO is preserved.
B. Reduced pulmonary capillary bed from pulmonary vascular disease (Why this does not fit)
Predict, then explain
Which test can raise suspicion for a vascular process?
A disproportionately low DLCO in the appropriate setting.
Does vascular disease alone unify these data?
No. Diffusion is preserved and the clinical respiratory pump is weak.
Read the complete explanation
A disproportionately low DLCO in the appropriate setting. No. Diffusion is preserved and the clinical respiratory pump is weak.
C. Reduced expansion from a respiratory pump disorder with relatively preserved exchange membrane (Best answer)
Predict, then explain
Which volume confirms restriction?
TLC is below the lower limit of normal.
What suggests a relatively preserved gas-exchange membrane?
Adjusted DLCO and parenchymal CT are preserved.
How does weakness connect these findings?
Weak respiratory muscles can limit expansion without primary membrane destruction.
Read the complete explanation
TLC is below the lower limit of normal. Adjusted DLCO and parenchymal CT are preserved. Weak respiratory muscles can limit expansion without primary membrane destruction.
D. Restriction from increased alveolar membrane thickness (Why this does not fit)
Predict, then explain
Why consider fibrosis when TLC is low?
Parenchymal scarring can cause restriction.
What favors a pump limitation instead?
Preserved adjusted DLCO, no interstitial CT abnormality and progressive muscle weakness.
Read the complete explanation
Parenchymal scarring can cause restriction. Preserved adjusted DLCO, no interstitial CT abnormality and progressive muscle weakness.
E. Small-airway obstruction with substantial gas trapping (Why this does not fit)
Predict, then explain
Which ratio supports dominant expiratory obstruction?
A reduced FEV1/FVC.
What is measured instead?
The ratio is preserved and TLC is genuinely reduced.
Read the complete explanation
A reduced FEV1/FVC. The ratio is preserved and TLC is genuinely reduced.
Takeaway: After confirming restriction, use the transfer measurement and clinical examination to locate the limitation.
A. Respiratory-system compliance is equal; B’s lung compliance is three times A’s (Best answer)
Predict, then explain
What is whole-system driving pressure in both?
25 − 5 = 20 cmH2O, giving 400/20 = 20 mL/cmH2O.
What are the lung-distending pressure changes?
A: 20 − 5 = 15; B: 20 − 15 = 5 cmH2O.
How does the same volume compare across those changes?
400/5 is three times 400/15, so B’s lung compliance is three times A’s.
Read the complete explanation
25 − 5 = 20 cmH2O, giving 400/20 = 20 mL/cmH2O. A: 20 − 5 = 15; B: 20 − 15 = 5 cmH2O. 400/5 is three times 400/15, so B’s lung compliance is three times A’s.
B. B’s respiratory-system compliance is one-third A’s; B’s lung compliance is three times A’s (Why this does not fit)
Predict, then explain
Why can B’s isolated lung be more compliant?
More of its airway pressure change is taken up by the chest-wall component.
Why is its whole-system compliance not lower?
The same 400 mL still requires the same total 20 cmH2O airway pressure change.
Read the complete explanation
More of its airway pressure change is taken up by the chest-wall component. The same 400 mL still requires the same total 20 cmH2O airway pressure change.
C. Respiratory-system compliance is equal; lung compliance is also equal (Why this does not fit)
Predict, then explain
What does the identical airway plateau establish here?
Equal whole-system driving pressure at equal PEEP.
What prevents inferring equal lung-distending pressure?
The pleural pressure rises by different amounts.
Read the complete explanation
Equal whole-system driving pressure at equal PEEP. The pleural pressure rises by different amounts.
D. B’s respiratory-system compliance is three times A’s; lung compliance is equal (Why this does not fit)
Predict, then explain
Which measurements determine whole-system compliance?
Delivered volume and airway plateau-minus-PEEP pressure.
Do those differ between the models?
No. The distinction appears after subtracting pleural pressure changes.
Read the complete explanation
Delivered volume and airway plateau-minus-PEEP pressure. No. The distinction appears after subtracting pleural pressure changes.
E. Respiratory-system compliance is equal; B’s lung compliance is one-third A’s (Why this does not fit)
Predict, then explain
Which model needs less additional lung-distending pressure?
B, with a 5 rather than 15 cmH2O change.
Does less pressure for the same volume mean lower compliance?
No. It means higher compliance; the proposed ratio is reversed.
Read the complete explanation
B, with a 5 rather than 15 cmH2O change. No. It means higher compliance; the proposed ratio is reversed.
Takeaway: Equal airway driving pressures do not establish equal lung compliance when chest-wall pressure changes differ.
E. Extrathoracic segment; inspiratory flow improves (Best answer)
Predict, then explain
Which segment preferentially narrows during inspiration?
A variable extrathoracic segment with lower internal than surrounding pressure.
What happens when only outside pressure falls?
Inside-minus-outside pressure becomes more distending.
What follows for a compliant segment?
It tends to widen, improving inspiratory flow.
Read the complete explanation
A variable extrathoracic segment with lower internal than surrounding pressure. Inside-minus-outside pressure becomes more distending. It tends to widen, improving inspiratory flow.
Takeaway: Locate the variable obstruction, then reason from pressure inside minus pressure outside.
A. Positive local transmural pressure; equality occurs closer to the alveoli (Why this does not fit)
Predict, then explain
Why might +15 appear distending?
It is positive relative to atmosphere.
Which surrounding pressure must be subtracted instead?
The pleural pressure of +20, leaving a negative local transmural pressure.
Read the complete explanation
It is positive relative to atmosphere. The pleural pressure of +20, leaving a negative local transmural pressure.
B. Negative local transmural pressure; equality occurs closer to the alveoli (Best answer)
Predict, then explain
What pressure difference acts across the small airway wall?
15 − 20 = −5 cmH2O, favoring compression.
How much pressure can be lost before alveolar gas pressure equals pleural pressure?
Only 25 − 20 = 5 cmH2O, versus 10 in the comparison.
Where is equality reached with the smaller recoil margin?
Earlier along the alveolus-to-mouth path, closer to the alveoli.
Read the complete explanation
15 − 20 = −5 cmH2O, favoring compression. Only 25 − 20 = 5 cmH2O, versus 10 in the comparison. Earlier along the alveolus-to-mouth path, closer to the alveoli.
C. Negative local transmural pressure; the equal-pressure location is unchanged (Why this does not fit)
Predict, then explain
Why is the local pressure compressing?
The airway lumen is 5 cmH2O below surrounding pressure.
Why does unchanged pleural pressure not fix the equal-pressure location?
Alveolar recoil pressure is also relevant and is lower in the patient.
Read the complete explanation
The airway lumen is 5 cmH2O below surrounding pressure. Alveolar recoil pressure is also relevant and is lower in the patient.
D. Negative local transmural pressure; equality occurs closer to the mouth (Why this does not fit)
Predict, then explain
Which part correctly describes the local airway?
Its lumen pressure is lower than the surrounding pleural pressure.
Why does the equal-pressure point not move toward the mouth?
A smaller alveolar-to-pleural margin is exhausted after less pressure loss, closer to the alveoli.
Read the complete explanation
Its lumen pressure is lower than the surrounding pleural pressure. A smaller alveolar-to-pleural margin is exhausted after less pressure loss, closer to the alveoli.
E. Positive local transmural pressure; equality occurs closer to the mouth (Why this does not fit)
Predict, then explain
Does positive pressure relative to atmosphere establish airway opening?
No. Surrounding pleural pressure can be still higher.
What does reduced recoil do to the available pressure-loss margin?
It shrinks the margin, moving equality toward the alveoli rather than the mouth.
Read the complete explanation
No. Surrounding pleural pressure can be still higher. It shrinks the margin, moving equality toward the alveoli rather than the mouth.
Takeaway: Positive pressure relative to atmosphere can still be compressing when surrounding pleural pressure is higher. Reduced recoil moves the equal-pressure point toward smaller peripheral airways.
A. Delivery stays unchanged; consumption falls by about 33% (Why this does not fit)
Predict, then explain
Does unchanged arterial saturation establish unchanged delivery?
No. Flow is also required.
What does the full consumption product show?
The later product 3 × 48 exceeds 6 × 18, so consumption increases rather than decreases.
Read the complete explanation
No. Flow is also required. The later product 3 × 48 exceeds 6 × 18, so consumption increases rather than decreases.
B. Delivery falls by 50%; consumption rises by about 167% (Why this does not fit)
Predict, then explain
Which ratio gives a 167% increase?
48/18 compares extraction differences without accounting for flow.
Which additional change must be applied?
Cardiac output halves, leaving a 4/3 consumption ratio.
Read the complete explanation
48/18 compares extraction differences without accounting for flow. Cardiac output halves, leaving a 4/3 consumption ratio.
C. Delivery falls by 50%; consumption rises by about 33% (Best answer)
Predict, then explain
What happens to delivery when arterial content stays fixed and flow halves?
Delivery halves.
How does the saturation difference change?
It widens from 98 − 80 = 18 to 98 − 50 = 48 percentage points.
What is the resulting consumption ratio?
(3 × 48)/(6 × 18) = 4/3, an increase of about 33%.
Read the complete explanation
Delivery halves. It widens from 98 − 80 = 18 to 98 − 50 = 48 percentage points. (3 × 48)/(6 × 18) = 4/3, an increase of about 33%.
D. Delivery stays unchanged; consumption rises by about 33% (Why this does not fit)
Predict, then explain
Why is the consumption comparison plausible?
The wider extraction difference more than offsets lower flow.
What prevents delivery from remaining unchanged?
Delivery also depends on cardiac output, which is halved.
Read the complete explanation
The wider extraction difference more than offsets lower flow. Delivery also depends on cardiac output, which is halved.
E. Delivery falls by 50%; consumption falls by 50% (Why this does not fit)
Predict, then explain
Which quantity falls with flow alone here?
Delivery, because arterial content is unchanged.
Why does consumption not simply halve?
The arterial-to-venous oxygen difference widens substantially.
Read the complete explanation
Delivery, because arterial content is unchanged. The arterial-to-venous oxygen difference widens substantially.
Takeaway: A lower mixed venous saturation reflects extraction as well as delivery; quantify both rather than inferring metabolism from arterial saturation alone.
A. A: total CO2 content falls; B: oxygen saturation falls (Best answer)
Predict, then explain
How does oxygenation change CO2 and hydrogen-ion carriage?
It reduces those capacities, lowering total CO2 content at fixed PCO2.
What does greater acidity do to oxygen affinity?
It lowers affinity.
What happens to B’s saturation at fixed PO2?
Saturation falls, a different relationship from A’s Haldane effect.
Read the complete explanation
It reduces those capacities, lowering total CO2 content at fixed PCO2. It lowers affinity. Saturation falls, a different relationship from A’s Haldane effect.
B. A: total CO2 content stays unchanged; B: oxygen saturation falls (Why this does not fit)
Predict, then explain
Why might fixed PCO2 seem to mean fixed content?
Gas pressure and total gas content can be mistakenly treated as identical.
What changes capacity despite fixed PCO2?
Hemoglobin oxygenation changes binding and buffering.
Read the complete explanation
Gas pressure and total gas content can be mistakenly treated as identical. Hemoglobin oxygenation changes binding and buffering.
C. A: total CO2 content rises; B: oxygen saturation rises (Why this does not fit)
Predict, then explain
Which hemoglobin state carries more CO2 at fixed PCO2?
Deoxygenated hemoglobin, opposite to this prediction after oxygenation.
Which direction does acidity move affinity?
Downward, opposite to this saturation prediction at fixed PO2.
Read the complete explanation
Deoxygenated hemoglobin, opposite to this prediction after oxygenation. Downward, opposite to this saturation prediction at fixed PO2.
D. A: total CO2 content falls; B: oxygen saturation rises (Why this does not fit)
Predict, then explain
Which prediction correctly applies oxygenation?
A’s total CO2 content falls.
Why does acidification not raise saturation?
Greater acidity favors lower oxygen affinity.
Read the complete explanation
A’s total CO2 content falls. Greater acidity favors lower oxygen affinity.
E. A: total CO2 content rises; B: oxygen saturation falls (Why this does not fit)
Predict, then explain
Which prediction correctly applies acidity?
B’s saturation falls at the same PO2.
Why is A’s direction reversed?
Oxygenated hemoglobin carries less total CO2 at fixed PCO2.
Read the complete explanation
B’s saturation falls at the same PO2. Oxygenated hemoglobin carries less total CO2 at fixed PCO2.
Takeaway: Haldane changes CO2 carriage with oxygenation; Bohr changes O2 affinity with acidity.
Protein-rich edema after an inflammatory insult. It reduces aeration and can make the lung less compliant. Blood crosses poorly ventilated units, increasing shunt-like physiology.
Takeaway: Inflammatory barrier failure can produce both a stiff lung and perfused units that are poorly ventilated.
A. PaO2/FiO2 falls from 160 to 125; alveolar ventilation falls to one-third of baseline (Why this does not fit)
Predict, then explain
How large is the reduction in ventilation?
One-third of the original amount.
How much ventilation remains?
Two-thirds, not one-third.
Read the complete explanation
One-third of the original amount. Two-thirds, not one-third.
B. PaO2/FiO2 rises from 125 to 160; alveolar ventilation remains unchanged (Why this does not fit)
Predict, then explain
Which time point actually has the larger oxygenation ratio?
The initial sample, not the later sample.
What contradicts unchanged useful ventilation?
PaCO2 rises from 40 to 60 at unchanged production and new steady state.
Read the complete explanation
The initial sample, not the later sample. PaCO2 rises from 40 to 60 at unchanged production and new steady state.
C. PaO2/FiO2 rises from 160 to 200; alveolar ventilation falls to two-thirds of baseline (Why this does not fit)
Predict, then explain
Which denominator gives the tempting 200?
Using the old FiO2 of 0.50 for the later PaO2 of 100.
Which FiO2 applies to that later sample?
0.80, giving 125.
Read the complete explanation
Using the old FiO2 of 0.50 for the later PaO2 of 100. 0.80, giving 125.
D. PaO2/FiO2 falls from 160 to 125; alveolar ventilation falls to two-thirds of baseline (Best answer)
Predict, then explain
How do the oxygenation ratios compare?
80/0.50 = 160; 100/0.80 = 125.
What is the inverse ventilation ratio?
Initial PaCO2 divided by final PaCO2: 40/60 = two-thirds.
Why can PaO2 rise despite this worse ratio?
The supplied oxygen fraction increased proportionally more than PaO2.
Read the complete explanation
80/0.50 = 160; 100/0.80 = 125. Initial PaCO2 divided by final PaCO2: 40/60 = two-thirds. The supplied oxygen fraction increased proportionally more than PaO2.
E. PaO2/FiO2 falls from 160 to 125; alveolar ventilation rises to 150% of baseline (Why this does not fit)
Predict, then explain
Which part correctly evaluates oxygenation?
The ratio falls from 160 to 125.
Why is the ventilation direction reversed?
At steady production, higher PaCO2 indicates less, not more, alveolar ventilation.
Read the complete explanation
The ratio falls from 160 to 125. At steady production, higher PaCO2 indicates less, not more, alveolar ventilation.
Takeaway: A rising PaO2 can hide worsening oxygenation efficiency; use PaCO2 separately to assess useful ventilation.
A. Asbestos-related pleural plaques without demonstrated parenchymal asbestosis (Best answer)
Predict, then explain
Where are the abnormalities?
Parietal and diaphragmatic pleura, not the lung interstitium.
What does the occupational pattern support?
Prior asbestos exposure with asbestos-related plaques.
What does it not establish?
Interstitial fibrosis, restriction or an existing cancer.
Read the complete explanation
Parietal and diaphragmatic pleura, not the lung interstitium. Prior asbestos exposure with asbestos-related plaques. Interstitial fibrosis, restriction or an existing cancer.
B. Malignant pleural mesothelioma (Why this does not fit)
Predict, then explain
Why consider this in an exposed worker?
Asbestos increases mesothelioma risk.
Do sharply bounded plaques establish malignancy?
No. No pleural mass, encasing thickening or effusion is reported; plaques are not themselves mesothelioma.
Read the complete explanation
Asbestos increases mesothelioma risk. No. No pleural mass, encasing thickening or effusion is reported; plaques are not themselves mesothelioma.
C. A calcified pleural rind from previous empyema (Why this does not fit)
Predict, then explain
Can an old pleural infection leave calcification?
Yes, particularly a dense rind after empyema.
What favors the exposure explanation instead?
Multiple circumscribed bilateral parietal and diaphragmatic plaques fit asbestos-related disease better than a postinfectious rind.
Read the complete explanation
Yes, particularly a dense rind after empyema. Multiple circumscribed bilateral parietal and diaphragmatic plaques fit asbestos-related disease better than a postinfectious rind.
D. Diffuse pleural fibrosis causing restrictive mechanics (Why this does not fit)
Predict, then explain
How can widespread pleural fibrosis affect function?
It may restrict expansion and reduce lung volumes.
Why is that not the best interpretation?
These are focal plaques, not diffuse thickening, and TLC is normal.
Read the complete explanation
It may restrict expansion and reduce lung volumes. These are focal plaques, not diffuse thickening, and TLC is normal.
E. Parenchymal asbestosis with physiologic restriction (Why this does not fit)
Predict, then explain
What compartment defines parenchymal asbestosis?
Interstitial lung fibrosis rather than an isolated pleural plaque.
Which supporting findings are absent?
CT shows no interstitial fibrosis and TLC does not demonstrate restriction.
Read the complete explanation
Interstitial lung fibrosis rather than an isolated pleural plaque. CT shows no interstitial fibrosis and TLC does not demonstrate restriction.
Takeaway: Pleural plaques support prior exposure; they do not by themselves diagnose interstitial asbestosis or cancer.
A. Active tuberculosis is established by IGRA; culture can be deferred because the smear is negative (Why this does not fit)
Predict, then explain
Can a positive IGRA establish active pulmonary tuberculosis?
No. It cannot distinguish active disease from latent infection.
Why does the negative smear not make culture unnecessary?
Smear-negative disease remains possible, and culture helps establish the organism and susceptibility.
Read the complete explanation
No. It cannot distinguish active disease from latent infection. Smear-negative disease remains possible, and culture helps establish the organism and susceptibility.
B. Active pulmonary tuberculosis remains possible; obtain respiratory NAAT and mycobacterial cultures (Best answer)
Predict, then explain
Does a prior positive IGRA distinguish current active disease from latent infection?
No. It demonstrates an immune response to infection, not the current disease state.
Does one negative smear exclude active pulmonary tuberculosis?
No. Smear sensitivity is insufficient to exclude it.
What addresses the current organism-level question?
Respiratory nucleic-acid testing and cultures, alongside appropriate clinical and infection-control assessment.
Read the complete explanation
No. It demonstrates an immune response to infection, not the current disease state. No. Smear sensitivity is insufficient to exclude it. Respiratory nucleic-acid testing and cultures, alongside appropriate clinical and infection-control assessment.
C. Smear-negative tuberculosis can be assessed by repeating an infection skin test instead of respiratory sampling (Why this does not fit)
Predict, then explain
What does an infection skin test measure?
Immune sensitization rather than organisms causing the present pulmonary illness.
What evidence is still needed?
Direct respiratory testing and clinical evaluation for active disease.
Read the complete explanation
Immune sensitization rather than organisms causing the present pulmonary illness. Direct respiratory testing and clinical evaluation for active disease.
D. Latent infection best explains the cavity; repeat IGRA to assess progression (Why this does not fit)
Predict, then explain
Why does latent infection alone fail to explain the new presentation?
The new cavity and constitutional illness require assessment for active disease.
What does repeating IGRA fail to determine?
Whether infection is currently producing pulmonary disease.
Read the complete explanation
The new cavity and constitutional illness require assessment for active disease. Whether infection is currently producing pulmonary disease.
E. Active tuberculosis is unlikely enough to exclude; investigate fungal disease without further mycobacterial testing (Why this does not fit)
Predict, then explain
Why can fungi remain in the differential?
Other infections can also cause cavities.
Why is exclusion of tuberculosis unjustified here?
Silicosis, new constitutional illness and a cavity retain substantial concern despite one negative smear.
Read the complete explanation
Other infections can also cause cavities. Silicosis, new constitutional illness and a cavity retain substantial concern despite one negative smear.
Takeaway: An infection-sensitization test does not distinguish active from latent tuberculosis, and a negative smear does not exclude active disease.
A. A: no beryllium sensitization; B: chronic beryllium disease (Why this does not fit)
Predict, then explain
Can sensitization be present without symptoms?
Yes.
Which finding contradicts calling A unsensitized?
The confirmed abnormal beryllium-specific proliferation response.
Read the complete explanation
Yes. The confirmed abnormal beryllium-specific proliferation response.
B. A: chronic beryllium disease; B: chronic beryllium disease (Why this does not fit)
Predict, then explain
Why might both positive tests tempt the same label?
They demonstrate sensitization to the same exposure.
Which disease requirement is missing for A?
Evidence of a granulomatous inflammatory response or compatible demonstrated lung disease.
Read the complete explanation
They demonstrate sensitization to the same exposure. Evidence of a granulomatous inflammatory response or compatible demonstrated lung disease.
C. A: beryllium sensitization; B: sarcoidosis established by biopsy (Why this does not fit)
Predict, then explain
Do noncaseating granulomas alone establish sarcoidosis?
No. They are not unique to that diagnosis.
What ties B’s shared tissue pattern to another cause?
Confirmed beryllium sensitization with compatible exposure and lung disease.
Read the complete explanation
No. They are not unique to that diagnosis. Confirmed beryllium sensitization with compatible exposure and lung disease.
D. A: chronic beryllium disease; B: sensitization without demonstrated lung disease (Why this does not fit)
Predict, then explain
Which worker has documented organ involvement?
B, with compatible granulomatous lung inflammation and decline.
Why is this pair reversed?
A lacks demonstrated lung disease while B has it.
Read the complete explanation
B, with compatible granulomatous lung inflammation and decline. A lacks demonstrated lung disease while B has it.
E. A: beryllium sensitization without demonstrated lung disease; B: chronic beryllium disease (Best answer)
Predict, then explain
What does the confirmed abnormal proliferation test establish?
A beryllium-specific immune response consistent with sensitization.
What additional finding is present in B?
Compatible granulomatous inflammation in the lung with clinical disease.
Why not give A the same lung-disease label?
A’s evaluation finds no evidence of lung disease; sensitization alone does not establish it.
Read the complete explanation
A beryllium-specific immune response consistent with sensitization. Compatible granulomatous inflammation in the lung with clinical disease. A’s evaluation finds no evidence of lung disease; sensitization alone does not establish it.
Takeaway: Beryllium sensitization and granulomatous lung disease are related but not identical diagnoses.
C. Hypersensitivity pneumonitis (Why this does not fit)
Predict, then explain
Why is this a plausible competitor?
Inhaled organic antigens can cause occupational pulmonary illness.
What combined findings favor byssinosis?
First-shift cotton tightness easing over the week, obstruction without demonstrated interstitial fibrosis, and preserved TLC.
Read the complete explanation
Inhaled organic antigens can cause occupational pulmonary illness. First-shift cotton tightness easing over the week, obstruction without demonstrated interstitial fibrosis, and preserved TLC.
D. Asbestosis (Why this does not fit)
Predict, then explain
What supports parenchymal asbestosis?
Asbestos exposure with compatible interstitial fibrosis, often basal.
Which supporting elements are absent?
No stated asbestos exposure or demonstrated fibrotic restrictive pattern.
Read the complete explanation
Asbestos exposure with compatible interstitial fibrosis, often basal. No stated asbestos exposure or demonstrated fibrotic restrictive pattern.
E. Chronic beryllium disease (Why this does not fit)
Predict, then explain
Which exposure-specific illness can mimic sarcoidosis?
Chronic beryllium disease.
Why does it fit less well here?
The material is cotton and the weekly airway symptom pattern points elsewhere.
Read the complete explanation
Chronic beryllium disease. The material is cotton and the weekly airway symptom pattern points elsewhere.
Takeaway: Classify the exposure and measured physiological defect before applying a pneumoconiosis label.
.jpg)